 As approved for publication by Nuclear Fusion 7/7/17: 2017 Nucl. Fusion 57 116032 doi:10.1088/1741-4326/aa7e3e
Neutron and gamma flux distributions and their implications for radiation damage in the shielded superconducting core of a fusion power plant
Colin G Windsor1 and J Guy Morgan2
Abstract The neutron and gamma ray fluxes within the shielded high-temperature superconducting central
columns of proposed spherical tokamak power plants have been studied using the MCNP
Monte-Carlo code. The spatial, energy and angular variations of the fluxes over the shield and
superconducting core are computed and used to specify experimental studies relevant to radiation
damage and activation. The mean neutron and gamma fluxes, averaged over energy and angle,
are shown to decay exponentially through the shield and then to remain roughly constant in the
core region. The mean energy of neutrons is shown to decay more slowly than the neutron flux
through the shield while the gamma energy is almost constant around 2 MeV. The differential
neutron and gamma fluxes as a function of energy are examined. The neutron spectrum shows
a fusion peak around 1 MeV changing at lower energies into an epithermal E-0.86 variation and
at thermal energies to a Maxwellian distribution. The neutron and gamma energy spectra are
defined for the outer surface of the superconducting core, relevant to damage studies.
The inclusion of tungsten boride in the shield is shown to reduce energy deposition.
A series of plasma scenarios with varying plasma major radii between 0.6 and 2.5 m was
considered. Neutron and gamma fluxes are shown to decay exponentially with plasma radius,
except at low shield thickness. Using the currently known experimental fluence limitations for
high temperature superconductors, the continuous running time before the fluence limit is reached
has been calculated to be days at 1.4 m major radius increasing to years at 2.2 m. This work
helps validate the concept of the spherical tokamak route to fusion power by demonstrating
that the neutron shielding required for long lifetime fusion power generation can be accommodated
in a compact device.
PACS numbers: 52.55.Fa, 28.52.-s, 84.71.Ba
1. Introduction Investigations with a system code have shown that the use of high temperature superconducting
magnets in a spherical tokamak may allow an appreciable fusion gain with the comparatively low
plasma major radius R0=1.35 m [1]. Computations using the Monte Carlo code for N Particles [2,3]
(MCNP Version 6.1) have shown that the superconducting column of such a tokamak might
have a manageable heat deposition of order 50 kW [4,5] using a neutron shield of around 0.32 m
thickness. However, there is concern that radiation damage of the superconductors may limit the
lifetime of any such plant. At present, there is only limited experimental data on such damage [6],
and the Vienna TRIGA Mark II reactor [7] used had a fission neutron spectrum not representative
of a fusion reactor. Experimental HTS lifetime data with realistic neutron and gamma flux energy
distributions, and the relevant cryogenic irradiation temperatures will not be easy to come by,
and so flux calculations with associated radiation damage calculations may be the only available
option for some time. The present studies predict the neutron and gamma ray energy spectra
relevant to the radiation damage problem in the shielded superconducting core of a fusion plant.
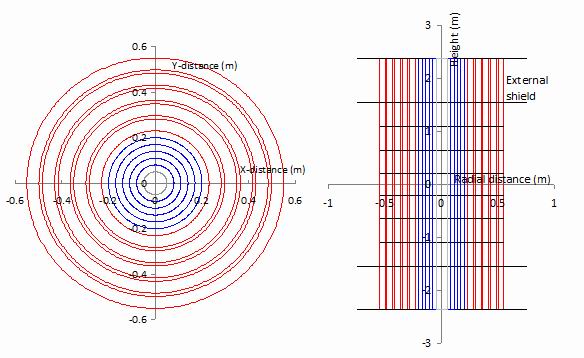
The simplified radial geometry of the spherical tokamak centre column used in the MCNP
calculations is shown to the left in figure 1. In the centre is a cylindrical tie-rod of stainless steel
and radius 0.05 m. Although the tie rod is divided into a further three surfaces of intermediate
radius, these were not used for flux tallying. The high temperature superconductor core lies
at radii between 0.05 m and 0.2 m. It is homogenised in composition and is divided into five
annular volumes by the four cylindrical surfaces at intermediate radii shown in the figure.
Between 0.2 m and 0.23 m radius is a vacuum gap inserted to make a thermal shield between
the cryogenic column at around 20 K and the neutron shield at ambient temperatures.
The neutron shield is at radii between 0.23 m and 0.55 m, and is made from five annular
volumes each 0.052 m thick composed of a tungsten carbide or boride alloy, separated by
four water channels each 0.015 m thick.
The vertical section to the right of figure1 shows how the central core and shield are
divided by planes into 9 segments of unequal thickness detailed in [5]. The highest and
lowest segments lie within the external shield.
Figure 1.
The plan and vertical section of the geometry used showing the defining surfaces at which the
fluxes have been calculated. The vertical scale has been compressed in the right-hand figure.
MCNP tracks the 14.1 MeV energy neutrons produced near the centre of the plasma
and follows the neutrons, photons, protons and alpha particles produced by elastic scattering
and inelastic reactions as a function of their spatial, angular and energy distributions.
Here it is assumed that the neutrons are produced within a torus of elliptical cross section
at a major radius of R0=1.35 m with height +/- 0.14 m , and minor radius 0.0625 m. There is also an outer shield similar
to the inner shield shown in figure 1 but with thickness 0.37 m, covering radii between 2.15
and 2.52 m. MCNP tracks the flux of each type of particle as they cross the various tally
surfaces defined in the model. Here some 60 energy bins were used to define the flux
distributions, ranging from thermal energies of 10 meV up to 25 MeV in roughly logarithmic intervals.
In addition, fluxes are collected as a function of the angle at which the particles cross each
surface. For most computations, just four angular tallies were used depending on the
cosine of the angle q between the particle direction and the normal to the surface.
Fluxes are described by MCNP in terms of the number of particles crossing the surface in
the given angular and energy bins per source neutron created. Clearly this depends on the
width of the energy bin, and the area of the surface. In this paper, fluxes will be described
in units of neutrons per second, per square metre, per MeV. For a plant with 140 MW
of neutron power, each neutron having an energy of 14.1 MeV or 2.26 x10⁻¹² joules, this
would correspond to a neutron production rate of 6.19 x10¹⁹ neutrons per second.
In sections 2 to 8, two averaged properties are discussed: the energy and
angle-integrated total flux through the shield, and the mean energy of the angle-integrated
flux through the shield. Next the energy distributions are presented for both neutrons and
gammas as a function of the position and nature of the shield. Lastly the angular distributions
of the neutrons and gammas are detailed. Sections 9 and 10 deal with a new set of
computations investigating the neutron and gamma flux distributions as a function of the plasma
major radius for a set of operating conditions where the calculated maximum mechanical stress
levels are roughly constant at an acceptable level. This enables the approximate lifetime of the
superconducting core to be estimated as a function of the major radius.
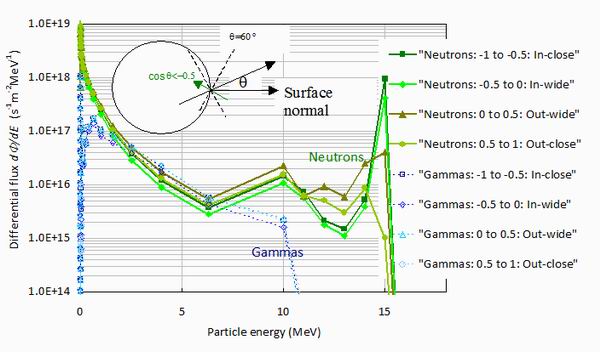
2. The flux incident on the outside surface of the central column The central column is bounded by a cylindrical surface 0.55 m in radius. This surface records
particles coming directly from the toroidal neutron source at 1.35 m radius, but also receives
additional neutron and gamma ray fluxes from particles scattered by the outer shield and by
particles scattered from within the central column. Figure 2 shows the neutron and gamma ray
fluxes incident on the mid-plane sector of the central column at heights +/- 0.2 m as a function
of energy for the four solid angle tallies. Particles entering the core have
cosq <0 and those
leaving it have cosq >0. Particles within
600 of the normal to the surface have |cosq| >0.5 and
those at wider angles than 600 (which have the same solid angle) have
|cosq| <0.5.
Figure 2.
The neutron and gamma ray fluxes incident on the mid-plane sector of the central column at
heights +/- 0.2 m on a log scale as a function of particle energy on a linear scale.
The green upper full lines with closed symbols are the neutron fluxes for the ranges of the
cosine of the angle to the normal shown. The lower blue dashed lines with open symbols are
for gamma fluxes.
Figure 2 shows that for energies above 10 MeV the neutron flux is dominant, and that
the 14.1 MeV fusion neutrons are mostly moving into the core, with much lower fluxes leaving
the core, possibly having passed through it, or having been created within it. Around 12 MeV
the situation has reversed and the flux leaving the core is higher as some of the incident
14.1 MeV neutrons are scattered back inelastically. At 11 MeV and below the neutron flux
is essentially isotropic. The gamma ray flux is seen to be low at energies above 10 MeV but
isotropic and to have a comparable or larger flux than the neutron spectrum at energies
between around 1 and 7 MeV. The angular distributions will be investigated in more detail in
section 8.
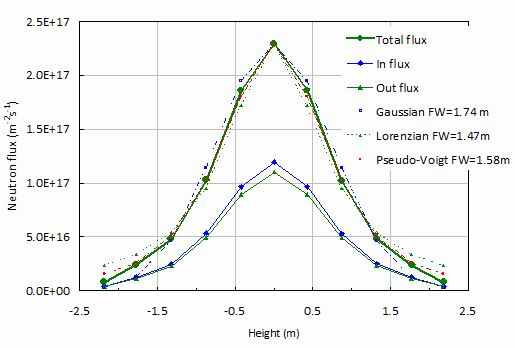
3. The height distribution of the central column flux
The central column was divided into 9 segments so that it is possible to determine the
vertical dependence of the flux into the central column. The segments were defined in [5]
and were not equal in height so the fluxes will be defined per m2 of area. It is seen from
figure 3 that the total neutron fluxes integrated over all energies into and out of the central
core are comparable. The dashed lines in the figure show fits to the vertical distribution.
This is seen to have a distribution lying between a Gaussian distribution with a full width at
half height of 1.74 m, and a Lorentzian distribution with a full width of 1.47 m. The heavier
dashed line shows the pseudo-Voigt function - a linear combination of Gaussian and Lorenzian
distributions [8]. It is shown to give a good fit to the numerical profile with a full-width at
half height of 1.58 m. It should be noted that these widths are rather lower than the good
fit to a Gaussian distribution of full width 2.0 m suggested by the vertical distribution of
deposited energy reported in reference [5]. In the remainder of this paper only the fluxes
in the central mid-plane region of the core at height from -0.2 to 0.2 m where the fluxes
are highest will be considered.
Figure 3.
The neutron fluxes on to the outer layer of the central column as a function of vertical distance
along the central column. The lower curves show the neutron fluxes from the plasma side into the
core and out of the core and are seen to be almost equal. The total flux is well fitted by a
pseudo-Voigt function between Gaussian and Lorenzian shapes with a full width at
half height of 1.58 m.
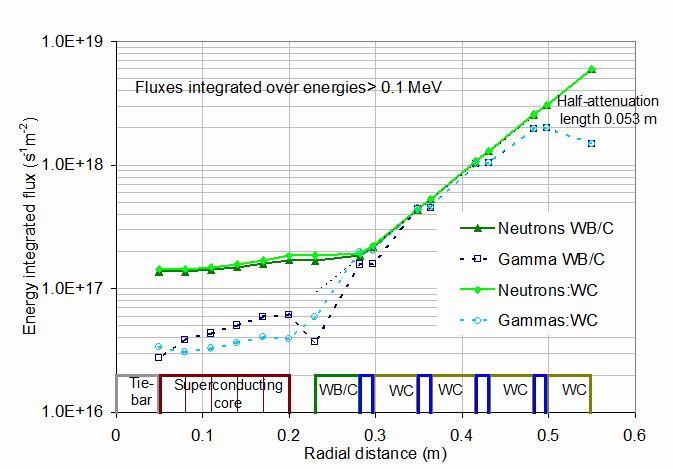
4. Energy-integrated neutron and gamma fluxes Figure 4 shows the neutron and gamma fluxes for energies >0.1 MeV at various surfaces
within the neutron shield and superconducting core. These layers are illustrated at the bottom
of the figure. The neutron shield is composed of 5 layers of cemented tungsten carbide
composite with an inner layer optionally of cemented tungsten boride. Between these are
water-cooling layers. There is a thermal gap of 0.03 m between the shield and the superconducting
core. Within this the superconducting core is measured at four intermediate surfaces as well as
its inner and outer surfaces. Only results from the central mid-plane vertical section of the core
where the fluxes are highest are shown. Figure 4 shows how the flux decreases through the
neutron shield and becomes nearly constant over the superconducting core. The shield
attenuation is roughly the same for neutrons and gammas and corresponds to a half-intensity
attenuation distance of around 0.053 m as shown by the dashed line.
Figure 4.
The neutron and gamma fluxes for energies over 0.1 MeV as a function of the radial distance
through the core. The fluxes crossing each tally surface are given for neutrons and gammas
and with either an all-tungsten carbide/water (WC) composite shield or one whose inner layer
is composed of tungsten boride (WB/C) composite. The rectangles at the bottom of the figure
indicate the various materials and their positions. The dashed line shows a half-intensity
attenuation distance of around 0.053 m, which is followed generally through the shield for
both neutrons and gammas.
For the boride-containing shield, the neutron flux >0.1 MeV in the superconducting layer
is almost constant at around 1.5 x10¹⁷ s-1m-2.
With the all tungsten carbide shield the
neutron flux is around 20% higher and decreases slightly into the core. The gamma fluxes
in the superconducting core are generally only around 20% of the neutron fluxes. The flux in
the boride-containing shield, at around 6 x10¹⁶ s-1m-2
is around 30% higher than in the carbide shield. Each 10B neutron capture emits a gamma ray
of 2.3 MeV energy, which may account for this. However, in the boride-containing layer itself
the gamma flux is lower than with the all-carbide shield.
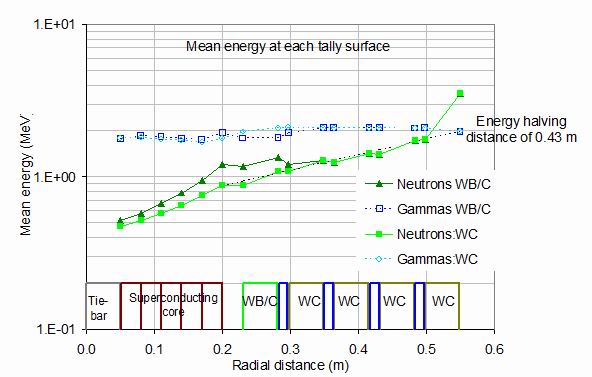
5. The mean neutron and gamma energies
A second averaged figure of importance is the mean energy of neutrons and gammas as they
pass through the shield and superconducting core. Figure 5 shows this for both tungsten carbide
and water shields and for those containing an inner layer of tungsten boride.
For neutrons, the average energy drops significantly across the shield. On the outer
plasma-facing surface the mean energy is 3.53 MeV, significantly lower than the fusion neutron
energy of 14.1 MeV, as many neutrons are scattered by the surrounding outer shield. In the water
layers of the shield there is little change in mean neutron energy, indeed, it sometimes rises slightly.
For the all-tungsten carbide shield, after the first layer, there is a smooth reduction in mean energy
across the rest of the shield. The dashed line in the figure corresponds to an energy-halving
distance of 0.43 m. The mean energy of the neutrons within the boron-containing layer of the shield
is increased by around 50% above that of the all tungsten carbide shield. This could represent the
onset of appreciable neutron absorption by 10B as the lower energy neutrons are preferentially
absorbed. In both shields the mean neutron energy continues to decrease with decreasing radius
into the superconducting core and tie-bar.
Figure 5.
The mean energy of the neutron and gamma fluxes as a function of the radial distance through
the core. Results are shown for both an all-tungsten carbide composite shield and for one whose
inner layer is composed of tungsten boride composite. The monitored surfaces are illustrated
at the bottom of the figure.
The gamma energies in figure 5 are seen to be almost constant across the shield at around 2 MeV
and almost identical between the all tungsten carbide and part boride shields. This is because the
gammas are largely created by (n,g) reactions in tungsten.
They have a cross section depending on energy but generally emit gammas with a range of energies
centred around a few MeV. The result is that the average gamma energies are higher than the
average neutron energies in all but the plasma-facing surface. Within the boride-containing layer
the gammas are seen to have around 10% lower mean energy than in the all-carbide segment.
This could be because the 10B (n,g)
capture produces gammas of 2.31 MeV - rather lower than the mean energy from tungsten
(n,g) capture.
6. The energy and radial dependences of the fluxes The total fluxes of figure 4 need to be further examined to reveal the dependence of the
neutron and gamma fluxes as functions of their energy. The flux F
is expressed as the
differential flux dq/dE per unit energy in MeV. This is necessary because the flux is divided into
energy bins of unequal, approximately logarithmically varying width. With this definition, typical
reactor neutron fluxes increase with decreasing energy, typically having the epithermal distribution
nearly inversely proportional to the neutron energy from 1 MeV to around 100 eV, then changing
to a Maxwellian distribution at thermal energies.
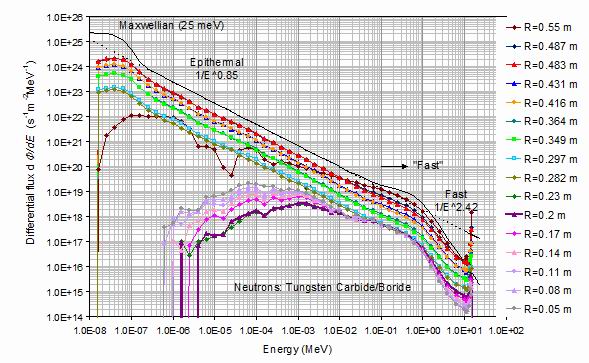
Figure 6.
The neutron differential fluxes for a tungsten carbide and water shield with an inner layer of
tungsten boride as a function of energy, for the radial surfaces defining the shield and
superconducting core. The legend shows the radius of each tally surface, which can be
correlated with the radial sections at the bottom of figures 4 and 5. The dark red diamonds
show the outer plasma-facing surface. The orange and green lines correspond to surfaces
in the shield, and the blue lines correspond to surfaces behind water layers. The heavy violet
triangles indicate flux at the outer surface of the superconducting core,
and the purple shaded lines below it the fluxes at the other tally surfaces within the core.
The dashed line indicates an energy dependence in the differential flux 1/E0.85
when E is
the energy in MeV, and the full line a simulated Maxwellian distribution at thermal energies
of 25 meV and including a fast neutron peak decaying with form 1/E2.42.
Figure 6 shows these distributions for neutrons in the tungsten carbide and water shield.
The energy scale goes from 10 meV, just below thermal energies, to well above the fusion neutron
production energy of 14.1 MeV. The peak in the energy distribution near 14 MeV is clearly seen
in the figure, and is maintained to some degree throughout the shield and superconducting core,
since some fusion neutrons traverse the shield and core unscattered.
Over a broad range of energies from 0.1 MeV down to 0.25 eV there is an almost linear slope
to the differential flux with an exponent E-0.85, so slightly less steep than the
epithermal 1/E energy distribution. At around 0.4 MeV the epithermal distribution changes into a
broad fast neutron peak in the differential flux. This peak is maintained without much change in
shape or relative amplitude at all the surfaces throughout the shield and core. This peak then decays
at the high-energy end as 1/E2.42. The full black line in the figure
shows this fast neutron peak modelled by the function:
dF/dE=AE-0.85.T(E) +BE-2.42[1-T(E)] ,
where A and B are amplitudes depending on the surface radius, and T(E)
is a transfer function depending on the logarithm of the energy of form:
T(E)=1/{1+exp[ln(E)-ln(ET)]/ln(WT)} where the transfer energy
ET and transfer width WT are both about 0.7 MeV.
An exception to this distribution is the plasma-facing surface shown by the dark red diads.
This occupies the top of the distributions above 0.01 MeV but its flux decays much faster with decreasing
energy than the inner surfaces to reach a flux around that at the back of the neutron shield below 15 eV.
Around 25 meV a Maxwellian distribution replaces the epithermal energy dependences.
In this distribution, the neutrons cease to lose energy on average, as they collide with atoms at
thermal energies, assumed here to correspond to 300 K or about 25 meV. The Maxwellian distribution
takes the form:
dF/dE=F0(E/kT)2*exp(-E/kT)
where F0 is the total flux integrated over all energies
and is set equal to 1018 ns-1m-2 in the figure. It is interesting that there is
no trace of a Maxwellian distribution at the outer surface of the shield (the dark red diamonds).
Both sides of the outermost water layer show a clear Maxwellian contribution and this stays much the
same until the boron-containing shield layer when it disappears completely.
The figure shows the differential flux in the water layers by blue tinted lines. These lie very close
to the corresponding inner tungsten carbide surface and are difficult to distinguish except near the region
around 0.4 MeV. This is consistent with the total fluxes shown in figure 4, which only dip slightly in the
water layers.
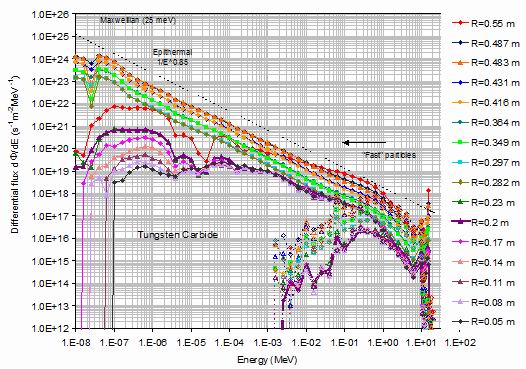
Figure 7.
The figure shows the neutron (full lines and closed symbols) and gamma (dashed lines and
open symbols) differential fluxes for the mixed tungsten carbide and water shield plotted as a
function of energy for all the radial surfaces defining the shield and superconducting core.
The heavy lines indicate the outer edge of the superconducting core. The dashed line
shows an epithermal neutron distribution and the full line a Maxwellian corresponding to 25 meV
thermal energies.
The outside surface of the superconducting core is shown by the heavy violet triangles and line.
This line defines the maximum fast neutron flux seen by the superconducting core. It is seen that over
an energy range from 1 MeV to 10 keV the surfaces within the superconducting core have closely
similar fluxes. Below this energy, the differential flux rises slightly across surfaces inwards towards the
centre of the superconducting core. This could be because of the increasing distance from the neutron
absorbing boron layer. This effect is reversed in the all-tungsten carbide shield as shown in the following
figure 7. However, this low energy range is of little significance for radiation damage.
Figure 7 shows the closely similar results for a shield composed of just tungsten carbide composite
and water. Note that including the gammas, the vertical flux scale is extended to 100 times lower values.
The neutron fluxes are very different in that the fluxes in the previously borated shield layer next to the
core (shown in green) are very much larger. The neutron fluxes within the core extend to much lower
energies and remain quite flat right down to thermal energies. The clear advantage
of a borated shield layer is evident from the much lower thermal and epithermal neutron fluxes in
figure 6 compared with figure 7. There is a sharp dip in the flux around 25 meV, not seen with the
boride containing shield. The origin of this dip remains uncertain.
The gamma flux is shown by the dashed lines and open symbols with the same colours. It differs
only slightly from the gamma flux in the tungsten boride-containing shield. While it is generally much lower
than the neutron flux there is an energy range between 2 and 6 MeV when it is larger. The gamma flux
attenuates rapidly below 1 keV and above 10 MeV and also drops rapidly to a value five orders of
magnitude below its peak values around the MeV region. The forms of the spectra are quite different
from the neutron spectra. They contain several distinct peaks at, for example, near 10 keV, 60 keV
and 0.6 MeV. This time the water layers are almost identical to the outer carbide layer until below
10-2 MeV, when the gamma flux is appreciably higher in the water layers.
Again, the fluxes crossing the outer surface of the superconducting core at a radius of 0.2 m are
shown by the heavy violet lines. Other violet lines indicate surfaces within the superconducting core. In the
case of neutrons for this shield it generally represents the largest flux seen in the core region with only a
modest further reduction towards the centre of the superconducting core. In the case of gammas, the
flux within the core is nearly constant.
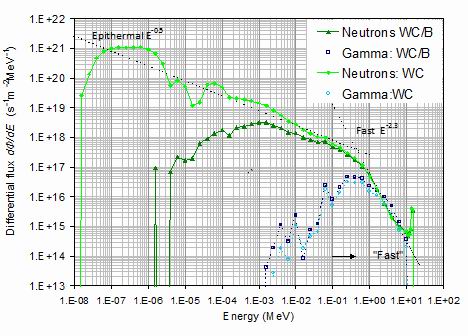
7. The flux distributions at the surface of the core Figure 8 shows the neutron and gamma differential fluxes plotted just for the surface at radius 0.2 m
defining the outside of the superconducting core. These are the surfaces shown by the violet lines in
figures 6 and 7, but also include the all-tungsten carbide, boride and water shield results. These results
define the nature of the radiation spectrum needed to test the lifetime of the high temperature
superconducting tapes.
It is seen that the presence of the boride-containing layer next to the core makes a considerable
difference in the neutron flux below 0.1 MeV. The difference increases as the energy is reduced
and the boron absorption cross-section increases. With the boron-containing shield there is almost
no flux below 1 eV.
In the case of the gamma flux it is seen that at energies below 1 MeV the neutron flux is higher
than the gamma flux by an increasing ratio as the energy is reduced. However, over the range
between 2 and 6 MeV the gamma flux is higher than the neutron flux. The inclusion of the boride-containing
layer makes only a modest difference, however the boride increases the gamma flux by a factor
increasing as the energy is reduced from about 5% at 0.1 MeV rising to a factor five at 0.004 MeV.
Figure 8.
The neutron and gamma differential fluxes as a function of energy measured on the outer
surface of the superconducting core at a radius of 0.2 m. The four curves are for neutrons and
gammas and with either an all-tungsten carbide composite and water shield or one whose
inner layer is composed of tungsten boride.
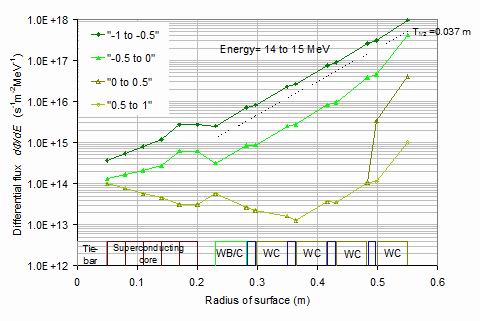
Figure 9.
The angular dependences of the neutron differential flux between 14 and 15 MeV as a function
of radial distance outwards from the centre of the superconducting core to the outer surface of
the shield at a radius of 0.55 m for the shield containing a tungsten boride inner layer. It is
seen that the 14.1 MeV fusion neutron anisotropy is maintained throughout the scan with the
inwards flux being consistently higher than the outwards flux by an order of magnitude or more.
The dashed line shows an intensity decrease into the shield halving in 0.037 m.
8. The angular dependences of the neutron and gamma fluxes As mentioned in section 2 the flux computations have been further broken down into four angular ranges,
inwards towards the core within 600 of the normal, shown with
cosθ as (-1 to -0.5), inwards at wider angle (-0.5 to 0),
outwards at wider angle (0 to 0.5) and outwards at smaller angle (0.5 to 1). It is possible to follow the
anisotropy of the differential flux as a function of radial position through the neutron shield.
The energy range from 14 to 15 MeV includes the fusion neutrons. Figure 9 shows this energy range
through a selection of the possible surfaces as a function of radius from the centre of the superconducting
core. The inwards, close-angle, flux is always higher than the large-angle flux, and much higher that the
outwards flux, which tends to be over 100 times lower near the centre of the shield. The gamma
fluxes are negligible for this energy range.
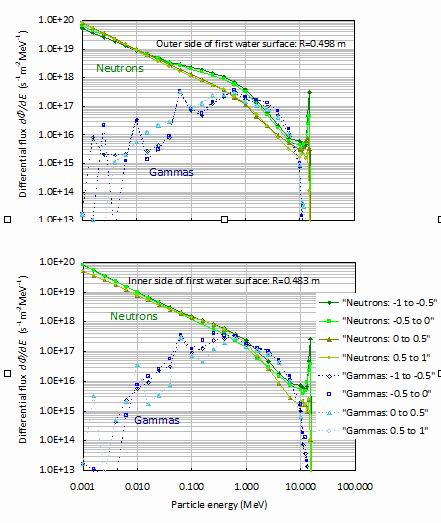
Figure 10.
The angular dependences of the neutron and gamma differential fluxes as a function of
energy measured for the two surfaces either side of the first water layer in the shield at
(i) radius 0.498 m on the outside of the first water layer, and (ii) at 0.483 m on the inside
of this layer. The sample had a tungsten carbide alloy and water shield with an inner layer
of tungsten boride.
Figure 10 shows the differential flux as a function of energy and angle for (i) the outer side of
the first water layer at 0.498 m, and (ii) the inner side of this water layer at 0.483 m. Several significant
differences can be seen. Around the 0.1 to 1 MeV energy range the inwards neutron flux on the
outside of the first water layer is around double than of the outward flux, but this difference is
reduced to only about 50% for the inner side of the first water layer. This 1.5 cm thick water layer is
therefore highly significant in making the neutron flux less directional. At epithermal energies below
0.1 MeV the flux is nearly isotropic in both cases.
In the case of the gammas, for example around 0.04 MeV, the inwards gamma flux is reduced
by around a factor of three from the outside of the first water layer to the inside. However, the
situation is reversed for the outwards gamma flux which is close to double the inwards flux on the
inside of the first water layer. Clearly the gammas produced in the tungsten carbide pass into the
water layer from both directions.
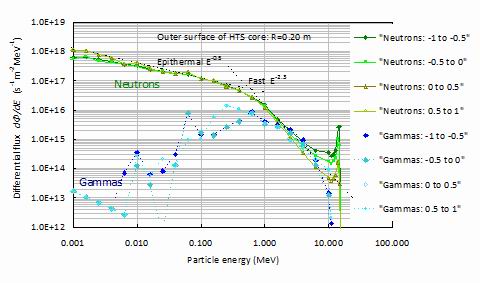
Figure 11 shows the angle dependent differential fluxes on the outer surface of the superconducting
core. It is seen that while the neutron flux is largely isotropic below around 1 MeV, there remains
considerable anisotropy in the flux distribution between around 4 MeV up to and including the
fusion energy of 14.1 MeV where the two inwards fluxes are around an order of magnitude larger
than the two outward fluxes.
The gamma fluxes are largely isotropic at energies down to 0.4 MeV but then develop considerable
anisotropy with the outwards going flux being an order of magnitude larger than the inwards flux around
250 keV. At around 60 keV there is a distinct gamma peak due to neutron capture reactions in the shield,
and the situation is reversed with the inwards flux being an order of magnitude higher.
Figure 11.
The angular dependences of the neutron and gamma differential fluxes as a function of energy
and direction, measured on the outer surface of the superconducting core at a radius of 0.2 m.
9. Neutron and gamma flux changes with plasma major radius
All the above computations have been for a fixed plasma major radius of 1.35 m. If it is essential
to reduce the flux either because of excessive radiation damage to the superconductors, or because of
too large a cryogenic heat load, one solution is to increase the plasma major radius. This increase is
complicated by the fact that in any such radial scan there is wide choice of possible scans, depending
on which variables are held constant. In the present work, the choice has been made to hold the
fusion gain constant at 5, the aspect ratio constant at 1.8, and the IPB98y2 H factor
constant at 1.9. The central temperature was varied to give 0.8 of the Greenwald density limit and
the toroidal field adjusted to give 0.9 of the beta limit. A further consideration is that the mechanical
stresses in the tokamak must lie within acceptable limits. As described in [9], these conditions could
be satisfied over a wide range of plasma major radii if the increased extra space made available by
increasing the major radius is divided in the ratio 92% to the shield thickness and 8% to the HTS core
radius. A series of 13 MCNP computations were made using this fraction from major radius
R0=0.592 m, where the shield thickness vanishes, to
R0=2.50 m where the shield thickness is 0.782 m. All runs include a
constant vacuum gap of 0.015 m and a plasma wall gap of 0.025 m, which are half the thicknesses
assumed in the earlier results presented here. No allowance has been made for the vacuum vessel
thickness which would need to be included in a more realistic design. Table 1 shows a selection of parameters
used in the present radial scan. Another difference is that the superconducting material extends into the
region previously occupied by a steel tie-bar. The shield material was tungsten carbide composite and
water without the presence of any boride.
Table 1.
The major parameters of a series of possible tokamaks with increasing major radius. All have a constant fusion gain of 5,
aspect ratio of 1.8 and HIPB98y2=1.9, and have reasonable density and beta limits, compressive stress
and maximum field on the surface of the superconducting core. The radius of the core Tcon
increases slightly with major radius.
It is seen that the fusion power Pfus is roughly constant over the scan, as is the maximum stress.
Another important parameter is the maximum field at the surface of the superconductor Bcond .
This is seen to vary between 18.9 and 20.3 T, which corresponds to a feasible level for an HTS material at 30 K temperatures.
For all these runs the neutron and gamma fluxes were determined for the four angular bands,
and as a function of energy, although with only 18 energy bands rather than the 60 used
previously in this paper. The results from this series are given in detail in the supplimentary data
associated with this paper. Figure 12 shows the total neutron and gamma fluxes crossing the
mid-plane region of the outer surface of the superconducting core, integrated over energy, but
including only fast particles defined as having energies greater than 0.1 MeV, and including all
particle angles. It is seen that both neutrons and gammas approach a limiting exponential decay
at plasma major radii above around 1 m. For neutrons, this limiting slope is 7.08 m-1,
as indicated by the short-dashed line in figure 12. For gammas, the limiting slope is rather
higher as in the long-dashed line with the slope 7.38 m-1.
Figure 12.
The total neutron and gamma fluxes across the outside surface of the high temperature
superconducting core as a function of the plasma major radius R0 for the series of computations
detailed in table 1. Only particles with energies >0.1 MeV have been included, following the
definition of total flux used in reactor irradiation studies.
It is clear that at the lowest major radii below 1 m, when the shield thickness falls below 0.16 m,
that both the neutron and gamma flux are appreciably lower than that expected from the
exponential variation. At Ro=0.592 m where the shield thickness vanishes,
the flux levels are fractions 0.283 and 0.258 of the expected exponential variation for neutrons
and gammas respectively. This represents a favourable result since the fluxes are appreciably
less than might have been expected from extrapolation of results at larger plasma radius.
The differences can be well modelled by subtracting from the exponential variation
the function: 5.45x10¹⁹exp[ - 14.56(E0-0.592)]
for the neutrons and 1.745 x10¹⁹exp[ - 16.25(R0-0.6)]
for the gammas. The solid lines in figure 12 show that a fit to within about 3% can be made
to the whole flux variation with radius for both neutrons and gammas.
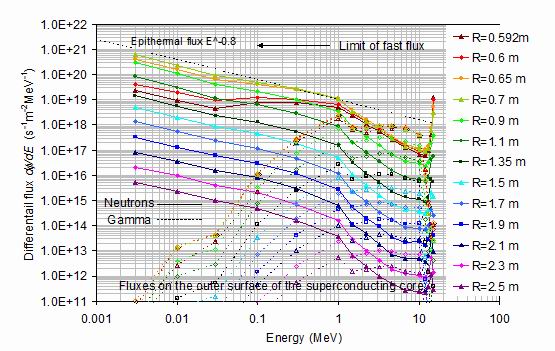
In figure 13 the total fast fluxes described in figure 12 are expressed as differential fluxes
as a function of energy. The full lines and closed symbols represent neutron fluxes and the
dashed lines and open symbols represent gammas. All fluxes refer to the outer surface of the
HTS core, and for the mid-plane vertical section where fluxes are highest. The figure is important,
as was figure 11, in that it describes the fluxes into the outer surface of the superconducting core
that will determine how the superconductor lifetime may be estimated.
Generally, the neutron differential fluxes follow those shown in figure 7 that has a higher
energy resolution. The rather sharp change of gradient of the neutron spectra at 1 MeV is
clearly shown to be the upper edge of a broad fast neutron peak. This peak is most pronounced
for major radii less than 0.65 m and then reduces rapidly at higher radii.
The gamma fluxes are appreciably higher than the neutron fluxes over the energy range
3 to 10 MeV. The difference is approximately a factor five and is maintained at all the
plasma radii considered from R0=0.6 to 2.5 m. At energies below
1 MeV they decrease quite rapidly with the differential flux dropping by 103 for each
decade of energy.
Figure 13.
The total neutron and gamma fluxes on the outer surface of the superconducting core plotted
as a function of energy for the various plasma major radii shown, following the parameters in the
radial scan indicated in table 1. The neutron fluxes use full lines and closed symbols, the
gamma fluxes use dashed lines and open symbols. An epithermal flux E-0.8 is shown by the
dashed line.
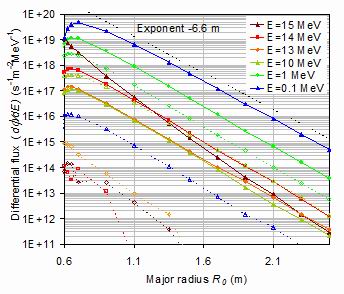
Figure 14.
The total neutron and gamma fluxes at the outer surface of the superconducting core
shown in figure 13, plotted as a function of major radius for given values of the energy,
to make clear their variation with plasma radius at high energies. As before, the neutron
fluxes use full lines and closed symbols, the gamma fluxes open symbols and dashed lines.
The curves have a generally exponential dependence with a roughly constant exponent
around -6.6 m-1 similar to that shown in the total flux curves of figure 12.
Figure 14 shows the differential flux variations from 0.1 to 15 MeV in greater detail by
expressing them as functions of major radius for selected energies. The curve defining the
14 to 15 MeV band includes the fusion 14.1 MeV neutrons and is seen to fall off relatively
quickly with radius. However, even by the 14 MeV band the attenuation with radius is close
to exponential and there is the same dip at low shield thickness that was seen in the
energy-integrated flux. The magnitude of this dip increases as the energy decreases.
The gamma flux is naturally very low for 13 to 15 MeV energies but then rises rapidly
and is some five times higher than the neutron flux at 10 MeV energies. By 1 MeV it is a
similar factor lower and by 0.1 MeV a factor 104 lower. Thus, gamma radiation cannot be
excluded but is quite limited in its energy range.
10. The expected lifetimes of High Temperature Superconductor tapes In any fusion reactor, it is necessary that the HTS tapes withstand the radiation penetrating
the shield for an acceptable time. Experimental studies to estimate this lifetime [6,10] have
been performed by placing tapes in the central irradiation facility of the TRIGA Mark II fission
reactor at the Vienna University of Technology [7]. The neutron dose was estimated by placing
a nickel foil adjacent to the specimens and calculating the fast neutron fluence (E>0.1 MeV) from
the activity of 58Co, formed by the neutron capture reaction with 58Ni.
Experiments were performed up to an irradiation fluence of 3.9x10²² m-2.
The irradiations were carried out at the normal ambient reactor temperature.
After the various irradiations were complete, cryogenic tests of the superconducting properties
were made. Results showed that the critical current when superconductivity was lost actually
increased for low fluences of order 1022 m-2 presumably as
new magnetic flux pinning sites were created. However at larger doses the critical current and
critical temperature decreased.
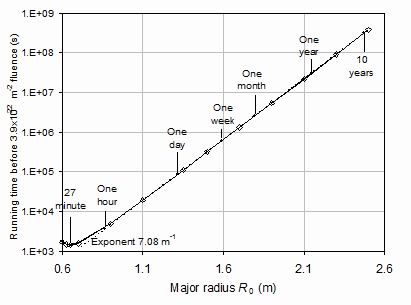
Figure 15.
The expected cumulative running time, at full neutron production rate, before the fluence on the
mid-plane of the HTS core reaches the value 3.9x10²² m-2. This is the fluence where
experimental data from fission reactor irradiation studies suggest the tape performance
deteriorates significantly. The major radius is changed along with other parameters to allow
fusion conditions as defined in Table 1.
The possible lifetime of the tapes may be estimated as a function of major radius for the
series of nearly constant stress configurations given in Table 1, by estimating the neutron flux
for energies >0.1 MeV as given in figure 12 and evaluating the number of seconds of continuous
tokamak running time before the fluence reaches 3.9x10²² m-2.
Such a plot is given in figure 15. In practice the operating availability for such a first of a kind
device would be very much less than 100% and as with fission; the best that can be expected
is in the low 90's.
These results must be treated with caution because of several important differences
between the fission reactor and tokamak HTS core irradiations. The fission reactor irradiation
temperature was ambient rather than the 20 to 30 K at which the HTS is expected to run.
This could mean that the damage creates new stable pinning centres, which could improve
the superconducting properties, but there could be effects in the other direction; for example,
the fluence at which the critical current begins to degrade could reduce. These effects may
be annealed out during higher temperature irradiation. It is also important to note that the
neutron and gamma fluxes from the fission reactor are likely to have different energy spectra
from those behind the shield of the tokamak. The need is for irradiation facilities which could at
least approximately reproduce the necessary flux distributions.
11. Conclusions The flux levels and energy distributions of neutron and gamma irradiation on the high
temperature superconductors of any fusion pilot plant are important because of the possible
degradation of its superconducting properties at high fluence. Monte Carlo MCNP computations
have been performed to compute the neutron and gamma fluxes within a 0.2 m radius
high-temperature superconducting magnet shielded by a 0.32 m thick combination of layers of
tungsten carbide and an optional tungsten boride layer separated by water cooling layers.
The major radius for this part of the study was R0=1.35 m and
corresponded to the pilot plant suggested in [1]. The total neutron flux integrated over energy,
and over all particle angles was shown to decrease exponentially through the shield with a
half intensity distance of order 0.055 m. The gamma flux decreases at a similar rate. Within
the superconducting core the neutron flux is roughly constant as shown in figure 4 with an
averaged value of order 2.4x10¹⁷ s-1m-2.
At this flux level a total neutron fluence of 3.9x10²² m-2
would be achieved in 1.8 days.
The mean energy of the neutron flux was evaluated and shown to decrease much more
slowly with a half intensity distance of 0.43 m. The mean energy of the gammas was seen
to be almost constant over both shield and core with a value of order 2 MeV.
The neutron differential flux as a function of energy is rather flat in the epithermal region
with an energy dependence of order 1/E0.85. Above around 0.1 MeV it turns into
a fast neutron distribution, which falls off steeply in the MeV range with a dependence of order
1/E2.4. The gamma flux is comparable to that of the neutrons in the MeV range
but falls off rapidly in the keV range.
The inclusion of the tungsten boride layer in the shield results in a strong attenuation of the
neutrons in the eV range, although this corresponds to only some 20% decrease in the total
energy-integrated flux. There is a corresponding increase in the gamma ray intensities.
The anisotropy of the fluxes was examined within four tallies of "into" and "out of" the
core and at "wide angles" and "narrow angles". The anisotropy of 14.1 MeV fusion neutrons was
shown to extend right through the shield and superconducting core. Gamma rays were shown
to be preferentially generated in the tungsten part of the shield and to penetrate into the water layers.
The possibility of longer operating times was examined by performing a series of MCNP
computations as a function of plasma major radius, designed to give a satisfactory and almost
constant compressive stress in the core region. This scan, which allowed for an 8% increase
in superconducting core radius as the major radius increased has been described by
Sykes et al [9]. It showed that, given the same neutron fluence limit of
3.9x10²² m-2, the lifetime of the device can be significanty
increased from months to years by increasing the plasma major radius from 1.8m to 2.2m.
This encouraging result helps validate the compact spherical tokamak route to fusion power
and demonstrates that the neutron and gamma shielding required for reactor relevant
operational lifetimes can be accommodated in a device of modest size.
Acknowledgements The authors are grateful to Greg Brittles, Alan Costley, Robert Slade, George Smith and
Alan Sykes for many fruitful technical discussions and cons`tructive criticism of the manuscript.
References [1] Costley A. E., Hugill J. and Buxton P. F. 2015 On the Power and Size of Tokamak Fusion
Pilot Plants and Reactors, Nuclear Fusion 55 033001
1Tokamak Energy, D5, Culham Science Centre, Abingdon, OX14 3DB
2Culham Electromagnetics, D5, Culham Science Centre, Abingdon, OX14 3DB
E-mail: colin.windsor@tokamakenergy.co.uk
R0 (m) Pfus (MW) Tcon (m) Tshield (m) BT (T) Bcond (T) Stress (Mpa) q* Psc (MW) Pmc (MW) 0.5918 205.92 .223 0 7.449 19.766 312.543 4.832 15.5 8.83 0.6 205.85 .2233 .0033 7.365 19.787 313.208 4.824 14.7 8.7 0.625 205.65 .2242 .0001 7.12 19.847 315.131 4.801 12.4 8.09 0.65 205.46 .2251 .0238 6.893 19.902 316.883 4.778 10.5 7.55 0.7 205.11 .2269 .0442 6.482 19.997 319.919 4.734 7.52 6.47 0.9 203.84 .234 .126 5.257 20.22 327.083 4.576 1.98 2.14 1.1 202.61 .2411 .2078 4.443 20.268 328.622 4.442 .519 .568 1.35 201.03 .25 .31 3.736 20.176 325.657 4.298 .0977 .103 1.5 200.05 .2553 .3713 3.416 20.068 322.186 4.222 .0358 .0375 1.7 198.74 .2624 .4531 3.07 19.883 316.276 4.129 .00941 .00992 1.9 197.42 .2696 .5349 2.79 19.665 309.383 4.046 .00247 .0026 2.1 196.11 .2767 .6167 2.559 19.425 301.878 3.97 .00065 .000691 2.3 194.81 .2838 .6984 2.365 19.171 294.02 3.901 .000171 .000186 2.5 193.53 .2909 .7802 2.2 18.907 285.993 3.837 .0000448 .0000518 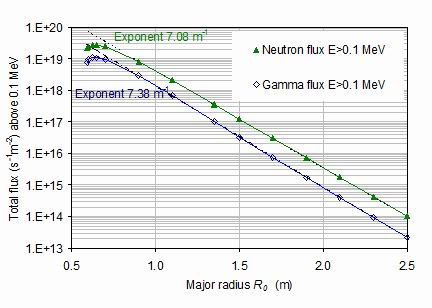
[2] Goorley T., James M., Booth T., Brown F., Bull J., Cox L. J., Durkee J., Elson J.,
Fensin M., Forster R. A., Hendricks J., Hughes H. G., Johns R., Kiedrowski B., Martz R.,
Mashnik S., McKinney G., Pelowitz D., Prael R., Sweezy J., Waters L., Wilcox T. and
Zukaitis T. 2012 Initial MCNP6 release overview Nuclear Technology 180 No. 3 298-315
[3] Shultis J. K. and Faw R. E., 2011
An MCNP primer : http://bl831.als.lbl.gov/~mcfuser/publications/MCNP/MCNP_primer.pdf,
,
http://www.nucleonica.net/wiki/images/6/6b/MCNPprimer.pdf
[4] Windsor C. G., Morgan J. G. and Buxton P. F. 2015
Heat deposition into the superconducting central column of a spherical tokamak fusion plant
published in Nuclear Fusion 55 023014
[5] Windsor C. G., Morgan J. G., Buxton P. F., Costley A. E, Smith G. D. W.
and Sykes A. 2016 Modelling the power deposition into a spherical tokamak fusion power plant
pubished in Nuclear Fusion 57 036001
[6] Prokopec R., Fischer D. X., Weber H. W. and Eisterer M. 2014
Suitability of coated conductors for fusion magnets in view of their radiation response
Superconductor Science and Technology 28 0953-2048-28-01400528
https://doi.org/10.1088/0953-2048/28/1/014005
[7] Weber H. W., Bock H., Unfried E. and Greenwood L. R. 1986
Neutron dosimetry and damage calculations for the TRIGA MARK-II reactor in Vienna,
Journal of Nuclear Materials 137 No 3 236-240 http://ati.tuwien.ac.at/reactor/EN/
[8] Temme, N. M. 2010, Voigt function, in Olver, F. W. J., Lozier, D. M., Boisvert, R. F., Clark, C. W.,
NIST Handbook of Mathematical Functions, Cambridge University Press, ISBN 978-0521192255, MR 2723248
[9] Sykes A., Costley A.E., Windsor C. G., Asunta O., Brittles G., Buxton P.,
Chuyanov V., Connor J. W., Gryaznevich M. P., Huang B, Hugill J., Kukushkin A.,
Kingham D., Morgan J. G., Noonan P., Ross J. S. H., Shevchenko V., Slade R, and Smith G.,
2016 Compact Fusion Energy based on the Spherical Tokamak, Submitted to
Nuclear Fusion , IAEA Fusion Conference (2016) Paper EX/P3 - 36.
[10] Chudy M., Fuger R., Eisterer M. and Weber H.W. 2011 http://ieeexplore.ieee.org/document/5721750/
Characterization of Commercial YBCO Coated Conductors After Neutron Irradiation
IEEE Transactions on Applied Superconductivity 21 No. 3