In the earlier paper [1] a step-wise approach was proposed starting with the simplest realistic model of a power plant,
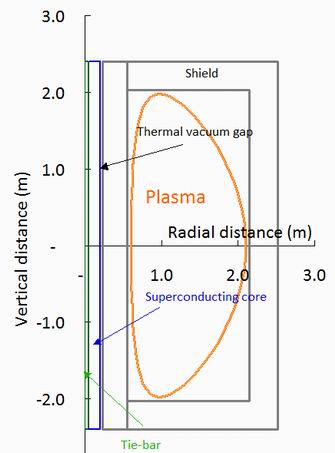
with a superconducting core of radius rsc, a neutron shield of thickness dshield and a toroidal plasma of major radius R0.
To this model several engineering variables have been added, such as a central tie-bar of radius rtie to help carry the
stresses induced in the core, a thermal vacuum gap of thickness dvac to insulate the cold superconducting core (say at 20 K)
from the warm neutron shield, and a plasma-facing wall gap of thickness dgap on the outside of the shield, which may
contain a vacuum vessel, and plasma-facing tiles. These additions are illustrated in figure 1.
Table 1. A selection of the input and output variables of the Tokamak Energy
System Code.
| Input parameter | Value | Output parameter | Value |
| Radius of central col, Rc (m) | 0.55 | Major radius of plasma R0 (m) | 1.35 |
Aspect ratio of plasma, A | 1.8 | Minor radius of plasma a (m) | 0.75 |
Elongation of plasma, kappa | 2.64 | Fusion power, Pfus (MW) | 175 |
Triangularity of plasma, delta (-) | 0.5 | Alpha power Palpha (MW) | 35 |
Initial radius of tie rod, Rtie (m) | 0.05 | Neutron Power Pneut (MW) | 140 |
Thickness of conductor, Tsc (m) | 0.15 | Current drive power, Pcd (MW) | 35 |
Thickness of vacuum shield, Tvac (m) | 0.03 | Rod current, Irod (MA) | 25 |
Thickness of inner shield, dshield (m) | 0.32 | Thickness of outer shield, (m) | 0.37 |
Plasma wall gap, g (m) | 0.05 | Central electron density, ne0 (x1020 m-3) | 3.83 |
Central temperature, T0 (keV) | 16.33 | Plasma current, Ip (MA) | 6.89 |
Wall loading Pwall (MW/m2) | 1.82 | Safety factor (Hugill definition) | 2.91 |
Fusion gain Qfus | 5 | Thickness of shielding, Tshield (m) | 0.32 |
Toroidal field, BT (T) | 3.65 | tauE' from IPB98y2 scaling (s) | 0.283 |
Average mass number | 2.5 | tauE from Petty2008 scaling (s) | 0.357 |
Density profile exponent, sn | 0.5 | H (IPB98y2) | 1.99 |
Temperature profile exponent, St | 1.5 | H (Petty2008) | 1.57 |
Max field on conductor, Bcond (T) | 25 | Heat deposition into core Ptot (MW) | 0.0536 |
An objective of this work was to enhance the utility of the Tokamak Energy System Code, described in [2] together
with its supplementary material. This reference suggested that further engineering details were planned to be
incorporated into the code and this has been done in the present work. The System Code has both input and
output variables and table 1 shows a selection of these variables defining the reference pilot plant design used
in the present paper. The numbers differ slightly from those in reference [2] because of subsequent refinements to the code.
was shown in [1] that the logarithm of the power deposition Ptot was linear in the three principal parameters
(R0, rsc, dshield) to around 5% accuracy over wide ranges and this result remains the starting point for the present work.
The power deposition into the cryogenic central superconducting core can then be represented in the System Code
by a single spreadsheet entry or MATLAB equation
logePtot= loge(Pneut/140) +
[loge(0.05286) - (R0 - 1.35)*1.276 + (rsc -
0.2)*6.752 - (dshield - 0.32)*13.733] (1)
Where Ptot is the total deposited power in MW and Pneut is the tokamak
neutron power in MW. 0.05286 is the power deposition in MW in the reference design and the next three terms are
the coefficients from [1] of the logarithm of the power deposition with respect to major radius R0,
superconducting core radius rsc, and shield
thickness dshield as deviations from their values in the reference design of table 1.
This equation will be extended
through this paper.
The details of the engineering extensions to the code are given in the Appendix. Their effects on the deposited
power are summarised in figure 2 for changes in parameters around the reference design with major radius R0=1.35 m,
superconducting core radius rsc =0.20 m, which includes a tie-bar radius rtie =0.05 m, so that the superconductor
thickness is dsc =0.15 m. Also included is a thermal vacuum gap dvac=0.03 m,
and a plasma-wall gap thickness dgap =0.05 m. These figures lead to a power deposition Ptot = 0.053 MW.
Using the System Code it is possible to evaluate how the power deposition changes as each of the variables
is changed individually.
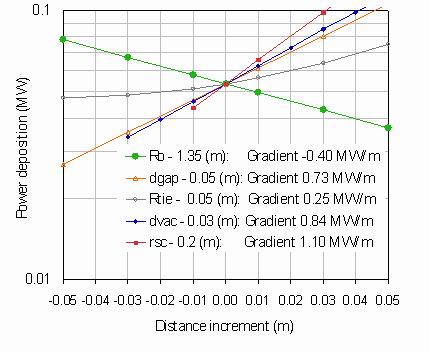
Figure 2.
The calculated deposited power into a central superconducting core of a simplified plant as a function of
superconducting core radius rsc, vacuum gap thickness dvac, wall gap thickness dgap ,
major radius R0
and tie-bar radius rtie All the results are presented against a single distance increment whose starting point
corresponds to the reference design with a central column radius Rc=0.55 m,
tie-bar radius rtie =0.05 m, the superconducting core radius rsc,=0.2 m, the vacuum gap dvac, =0.03 m,
shield thickness Tshield=0.32 m, plasma wall gap dgap=0.05 m, and major radius R0 =1.35 m.
When changing the wall gap and major radius the central column radius changes along with the fusion energy.
In all cases the shield thickness is changed to keep the major radius constant, the central temperature
adjusted to reach 0.8 of the Greenwald density limit and the toroidal field adjusted to reach 0.9 of the Troyon beta limit.
Figure 2 shows the power deposition on a log scale and it is clear that over this limited distance scale, all the variations,
except that due to the tie-bar radius, follow linear plots with distance on this logarithmic scale.
The gradients of the variables listed in decreasing absolute order are shown in the figure caption.
The tie-bar gradient is only appropriate near the value rtie=0.05 m.
It is seen that the superconducting core radius causes an appreciably faster variation than any of the other variables.
This may be understood because the power deposition into the core naturally varies as the core cross-sectional area,
so as the square of the core radius. In addition any increase in core radius causes a corresponding decrease in the
shield thickness to maintain a constant overall radius for the central column. Thus the minimisation of the core radius
is a key feature in any plant. The second most important term is the thermal vacuum gap thickness. Any increase here
diminishes the shield thickness directly. It is seen that reducing the 0.03 m vacuum gap thickness assumed here would
give a significant improvement. Increasing the plasma-wall gap is more complex as this alters the outer radius of the
whole core region (Rc) and so besides reducing the shield thickness, increases the fusion power.
However the net effect is closely similar to making changes in the vacuum gap thickness.
Changes in the tie-bar thickness are made with the constraint of a constant superconducting core cross-sectional area.
The end result is close to quadratic and is seen to give only a minor effect.
Increasing the plasma major radius does cause an appreciable decrease in the deposited power and so
suggests a clear solution if the deposited power is deemed too high.
3. Water-cooling channel effects in the design of the neutron shield
In the first estimates for the Costley et al power plant design [2], a cylindrical tungsten carbide alloy shield 0.32 m
thick was assumed, composed of 4 cylindrical water coolant layers of 0.0125 m thickness equally spaced within the shield.
The water fraction FW across the total thickness of the shield was thus 0.1875.
A set of computations was made choosing 6 different cooling channel thicknesses to vary this fraction between
0.094 and 0.28. The results are shown in table 2 and figure 3.
Table 2. The MCNP computation of deposited power Pmcnp
in the superconducting core as a function of the linear fraction fW of water in a tungsten carbide
alloy shield composed of 4 cylindrical water channels of equal width and spacing.
| Water fraction (fW) | 0.0938 | 0.125 | 0.1563 | 0.1875 | 0.2188 | 0.25 |
Pmcnp (MW) | 0.057 | 0.0542 | 0.0529 | 0.0533 | 0.0548 | 0.0575 |
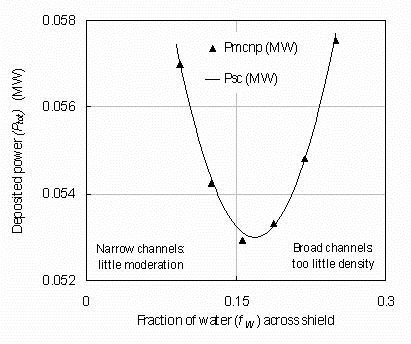
Figure 3. The MCNP calculation of deposited power Ptot
into the central superconducting core of a 1.35 m major radius pilot plant with a 0.32 m thick shield composed
of 4 cylindrical water layers within a tungsten carbide alloy shield, plotted as a function of the linear fraction
FW of water across the shield (triangles). The line shows the parabolic fit to the MCNP results used in the
System Code. Plasma parameters do not change during the scan.
Although the scale of figure 3 is expanded, it shows a rather rapid increase in the power deposition if the water fraction
is not within a relatively narrow range between 0.1 and 0.25. The optimum fraction is around 0.168. The line shows a
parabolic fit to the data with an additional power deposition for a water fraction FW equal to
ΔlogePtot = 0.715(FW - 0.168)2 in MW units. This term may also be added to the square bracket of equation 1.
Again this relationship can be expected to hold only for configurations not far from the reference plant variables.
A second set of computations was carried out to consider whether it would be preferable to have unequal water-cooling
spaces across the shield. In table 3 and figure 4 are shown the results for the power deposition as a function of the ratio
of the cooling channel thickness next to the core divided by the mean thickness. The power deposition is reduced
if the thickness of the water layer nearest to the core is greater than the average thickness. Clearly the extra moderating
capability of the water layers is preferable nearest to the core rather than nearest to the plasma. There is an optimum in
the thickness next to the superconducting core at about 1.66 times the average water thickness, when the power deposition
is reduced by about 9%.
Table 3. The power deposition Ptot into the central superconducting core of a 1.35 m major radius pilot plant with a
neutron shield of tungsten carbide alloy and water cooling channels, where the width of the channels varies from an
inner value dinner next to the core compared to the average value dmean.
| Material | 1/5 WB | 2/5 WB | 3/5 WB | 4/5 WB | Pure WB | Graded 1/5 WB |
| MCNP (MW) | 0.0364 | 0.0342 | 0.0335 | 0.0326 | 0.0327 | 0.0338 |
System code (MW) | 0.036 | 0.0346 | 0.0337 | 0.0331 | 0.0325 | 0.0349 |
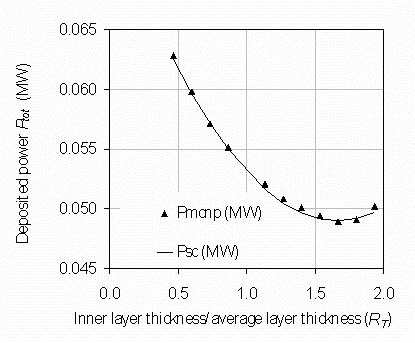
Figure 4. The MCNP calculated deposited power Pmcnp into the central superconducting core of a 1.35 m major radius
pilot plant as a function of the ratio RT of the thickness of the water-cooling layer nearest to the core divided by the
average thickness when the water channel thickness is varied linearly across the shield for a fixed total shield thickness
and total water thickness. Plasma parameters do not change during the scan.
The variation follows an approximately parabolic relationship with the relative thickness RT around this minimum.
The line in figure 4 corresponds to a System Code prediction of the power deposition change relative to the constant
water thickness RT=1 of ΔlogePtot=-0.00212+ 0.0095(RT-1.66)2 in MW units. Again this relationship can be
expected to hold only for configurations not far from the reference plant variables.
4. The choice and distribution of the neutron shield material
The earlier paper [1] considered several possible materials for the neutron and gamma shield necessary to limit
both the heating and the radiation damage of the superconducting core. These included water, hydrocarbon,
zirconium borohydride, and manganese/europium iodide, but excluded pure tungsten. A tungsten carbide alloy
combines the good gamma shielding properties of the tungsten with the good moderation properties of carbon.
The gamma shielding is dependent on the overall density, which is 19.25 g/cm3 for pure tungsten, and 15.63 g/cm3
for tungsten carbide. Good moderation requires low atomic weight materials such as carbon or hydrogen.
A different mode of shielding is to use atoms with a high absorption cross section such as boron. The isotope
10B in particular has a large neutron absorption cross section varying from 600 barns at 1 eV to around a barn at 10 MeV.
Tungsten boride alloys have been prepared in a similar way to those of tungsten carbide although they could be more
expensive and difficult to manufacture. Another possible advantage is that it has more favourable oxidation properties.
Tungsten carbide oxidises to volatile CO2 whereas tungsten boride refractory metal borides, (with appropriate silicon
additions) can form very stable borosilicate glasses [4,5].
Table 4. Table 4. MCNP computations of the power deposition in MW into the superconducting core for the 1.35 m plasma
radius pilot plant. Again the shields are 0.32 m thick with water-cooling in four layers 15 mm thick. Shields
composed of: pure tungsten (W), tungsten carbide alloy (WC) and tungsten boride alloy (WB) were considered.
Also the 5 shield carbide layers were replaced one by one with boride layers up to pure WB. The shields were
0.32 m thick with water-cooling in four layers 15 mm thick except for the "Graded 1/5" case where the water layer
thickness was graded to be larger next to the core.
| Material | 1/5 WB | 2/5 WB | 3/5 WB | 4/5 WB | Pure WB | Graded 1/5 WB |
| MCNP (MW) | 0.0364 | 0.0342 | 0.0335 | 0.0326 | 0.0327 | 0.0338 |
| System code (MW) | 0.036 | 0.0346 | 0.0337 | 0.0331 | 0.0325 | 0.0349 |
The phase diagram of tungsten boride is complex with several possible compounds. This study concentrates on WB,
which was found to be more favourable than WB2 suggesting that the heavy tungsten is the most useful atom.
Table 4 and figure 5 gives cause for optimism in the superconducting core shield design. Firstly the pure tungsten
shield material (with water cooling) gives a power deposition some 18% lower than tungsten carbide. However a
uniformly spaced shield of tungsten boride is seen to be considerably better being some 35% lower than tungsten carbide.
Bi-tungsten boride is also better than the carbide by 26% but it appears to have no advantage over tungsten boride
and will not be considered further.
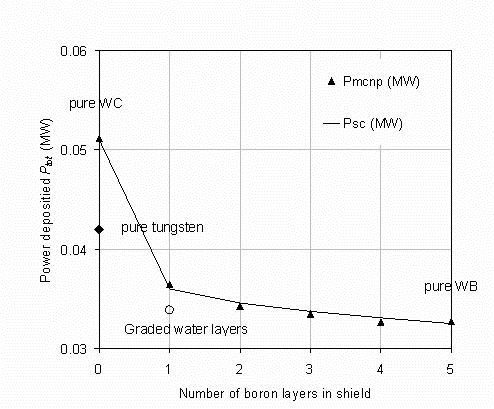
Figure 5.
The MCNP computations of power deposition into the superconducting column for tungsten carbide shields
with an increasing number of carbide shields replaced by boride from the core outwards. A pure tungsten shield is also shown.
The line is calculated from the System Code formula. The open circle shows the single inner boride layer with a
graded water thickness having more water close to the core. The closedopen diamond shows the deposited power
using a pure tungsten shield. Plasma parameters do not change during the scan.
Because tungsten boride particularly captures lower energy neutrons it might be better placed in the inner side
of the shield next to the superconducting core. An MCNP computation was made with just the inner of the five cylinders
of the shield composed of tungsten boride with the outer four cylinders nearest to the plasma being made of tungsten carbide.
A 29% reduction of the power deposition into the core was obtained. Putting the tungsten boride on the outer,
plasma side of the shield, where its volume is much larger, gave almost no improvement in the power deposition.
Replacing more of the carbide layers with boride gives only a minor improvement as shown in figure 5 although
replacing 4 out of 5 layers gave the best, 36% reduction. Having a single inner boron carbide layer with unequal
water spacing gave a 34% reduction as shown by the open circle.
The dependence of the power deposition on number of tungsten boride layers has been fitted for use in the
System Code as shown by full line in figure 5. The fit assumes an additional power deposition for a number nWB
of tungsten boride layers equal to
DlogePtot = 0.638+0.362*(1- nWB0.13/1.232) with Ptot in MW units.
5. Benchmarking the System Code power deposition over a range of plasma radius
The refinements to the power deposition calculations detailed here can be collected together into the equation
for the power deposition Ptot in MW
logePtot= loge(Pneut/140) +[loge(0.05419) -
(R0 - 1.35)*1.256 + (rsc - 0.2)*6.752 - (dshield - 0.32)*13.733
+1.53 * (dvac - 0.03)) ] * [1+13.4905(FW -0.168)2 - 0.091+
0.176(RT-1.66)2 + 0.638+0.362*(1- nWB0.13/1.232) +0.013+4.03rtie] (2)
where the new variables include the vacuum gap thickness dvac, the tie bar radius rtie, the length fraction of water
in the neutron shield FW, the ratio of the inner water layer thickness to the average thickness RT, and the number of
tungsten boride layers nWB.
Table 5.Some predictions of the power deposition from the System Code Psc compared with the MCNP Monte Carlo
computations Pmc for several possible tokamaks of differing radii. The first two have narrow superconducting cores.
The middle row is for the pilot plant [2]. The 4th row attempts to model the 1.4 m major radius plant design considered by
Brown et al [6], and the last row models a possible fusion power plant design of around 2 m major radius.
| Model | R0 | rsc | dshield (m) | HPpetty | PSC | PMC |
| Costley reference | 1.35 | 0.2 | 0.320 | 1.56 | 0.0536 | 0.0536 |
| Princeton design | 1.40 | 0.23 | 0.322 | 1.46 | 0.0182 | 0.022 |
| Major radius ~2 m | 2.1375 | 0.3 | 0.580 | 0.95 | 0.0011 | 0.0038 |
These terms have been incorporated into the System Code but the additions have mostly been made around
the major radius R0=1.35 m corresponding to the pilot plant proposed in [2]. Other plants with different major radii
are of importance and four further MCNP computations have been made as listed in table 5 and plotted against
major radius in figure 6. It is seen the Monte Carlo code computations generally agree well with the System Code
well near the reference design, but less well far away.
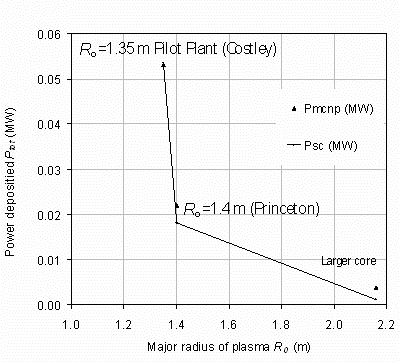
Figure 6.
The power deposition into the superconducting core for several tokamaks as a function of their major radius.
The points and line are the System Code predictions and the crosses the MCNP computations.
The Princeton point is an attempt to reproduce their 1.4 m radius study [6] with a 3.2T toroidal field,
around 100 MW fusion power and 1 MW/m2 wall loading. The 2.13 m point an attempt to model a design with around
2 m major radius with a 0.58 m thick shield giving only around 3 kW of energy deposition. Slimmer superconductor
cores have a maximum field on the conductor above 25 T. In this plot the Petty H factor is allowed to vary from 1.73
at R0=1.35 m to 0.95 at R0=2.13 m. All computations have the other input parameters listed in table 1 constant
and satisfy the defined density and beta limits.
An important engineering concern is the maximum field Bcond that can be allowed on
the superconductor. This will generally be at the outer surface of the superconducting core and will determine the
maximum toroidal field at the plasma centre. If the maximum field is chosen too high for a given operating temperature
then the probability of a quench is increased. If it is set too low then the performance of the magnet will be diminished.
This is illustrated in figure 7 which shows the change in the Petty 2008 H factor[7] as the maximum field on the
superconductor is varied. The variables mostly correspond to their reference values, and indeed the fusion and
deposited powers are unchanged. However the toroidal field increases from 2.96 to
4.44 T across the plot. The plasma pressure increases and the H factor decreases, leading to a greater fusion gain.
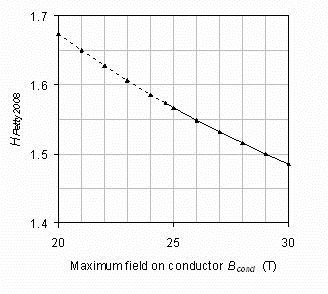
Figure 7. The change in the Petty 2008 H factor as the maximum
field on the superconducting core is varied. Most other variables are at their reference values.
The dashed line corresponds to the plasma pressure rising to larger than 0.9 of the beta limit.
6. The dependence of the power deposition on plasma radius and other variables
Using the Tokamak Energy System Code, Version 5 updated on 04/06/2015, and including the parameterised
power deposition defined in equation 2 it has been possible to predict how the power deposition into the central
column depends on other key parameters of a pilot plant. The following assumptions were made. A tie-bar
radius rtie = 0.05 m was used, with a vacuum gap dvac = 0.03 m, and a plasma wall gap 0.05 m.
These constraints for a major radius R0=1.35 m and a superconducting core radius rsc=0.20 m gave a
power deposition Ptot=53.2 kW with a neutron shield thickness dshield=0.32 m. Working from this starting point
it is possible to investigate the change in deposited power with a series of other variables.
The confinement time is an important variable, since the ratio of the energy confinement time to its scaling law
prediction defines the H factor, which is important in reaching fusion energy gain. Generally fusion gain will be
possible at lower fusion powers
if the energy confinement time is higher than that found from the scaling laws, that is H>1, and operation at low
fusion power is essential for smaller devices. The H factor according to the formalism of Petty in 2008 [7] for the
R0=1.35 m reference pilot plant configuration with the above engineering conditions was 1.563. This corresponds
to 1.98 against the ITER IPB98y2 scaling.
Extending the major radius beyond the 1.35 m for the proposed pilot plant may well be a necessary condition
if the high temperature superconductors need extra shielding protection to reduce radiation damage [8].
It is therefore prudent to consider using the System Code to evaluate the power deposition as a function of major radius.
Major radius is an output parameter of the System Code so the scans are made varying the radius of the
central column (Rc). The increase in major radius can be achieved by increasing either the shield thickness
or the superconducting core radius, or a combination of both. It is possible to do this while keeping many parameters
constant including, for example, the fusion gain and the tokamak aspect ratio, while keeping constant some chosen
parameter such as the deposited power, the radius of the superconducting core or the fusion power.
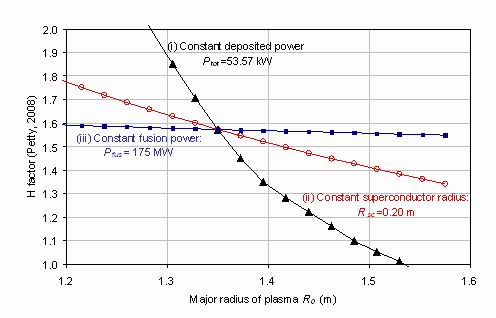
Figure 8. The required Petty[7] H factor, or ratio of the energy confinement time to the value predicted from scaling laws,
plotted against plasma major radius for (i) a constant deposited power Ptot=53.6 kW: (ii) a constant superconducting
core radius of rsc=0.2 m and (iii) a constant fusion power Pfus=175 MW achieved by adjusting the wall loading.
In all cases the central temperature and toroidal field have been adjusted to give the defined density and beta limits.
Other variables are kept constant as in table 1.
Figure 8 shows the dependence of the Petty[7] H factor on tokamak major radius according to three assumed
conditions. The black open triangles show the rapidly reducing H factor obtained if the scan is performed at a
constant deposited power. This is achieved by changing the wall loading to keep the deposited power at the
reference value 53.6 kW. The red circles, having a slower decrease in H factor with radius, is the calculation with
constant central core radius and varying shield thickness. An identical curve is obtained by varying the core radius
at constant shield thickness since the plasma conditions are unchanged. The deposited power varies from 0.135 to
0.054 kW across this curve. The blue triangles correspond to varying the wall loading until the fusion power equals
the constant value 175 MW of the 1.35 m major radius reference pilot plant. The small change in H factor is in
accordance with predictions that fusion power and the H factor are the key variables in determining the
tokamak power gain [2,9]. The deposited power reduces from 0.170 MW to 0.010 MW across this curve.
A conclusion from figure 8 is that increasing the plasma radius at constant fusion gain generally requires a lower
H factor primarily because the fusion power is increasing. The most favourable engineering design will generally use
the minimum H factor. In the following computations to explore the variation of deposited power with the plasma
major radius, a condition will be made that the Petty[7] H factor is kept at a fixed value, taken here at the value
HPetty:2008=1.563 of the reference design [2]. This is achieved by adjusting the wall loading input parameter
so that the constant H factor is maintained.
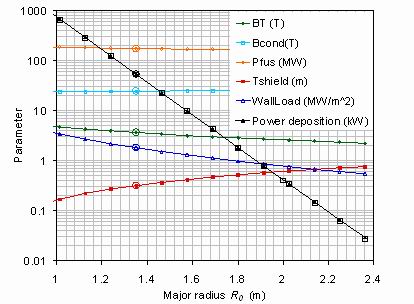
Figure 9.
The power deposition into the superconducting core as a function of plasma major radius for the condition
that the Petty H factor HPetty=1.573. The changes in toroidal field, maximum field on the superconductor, fusion power,
shield thickness and wall loading are also shown. The circled points show the R0=1.35 m case used to define the
constant Petty H factor. Other input variables are kept constant, with the values of table 1, except where adjusted to
give the appropriate density and beta limits. The open squares show an exponential fit to the power deposition showing
a factor 10 decrease for each 0.307 m increase in major radius.
In figure 9 an approach is taken where output results from the System Code are plotted as a function of the plasma
major radius under the assumption that the H factor remains constant. As many as possible of the input variables are
kept constant. In particular the superconducting core is kept at a constant radius and carries a constant total current
so that its construction need not be changed. To keep the assumed H factor constant, the wall loading input parameter
is changed. Figure 9 shows the power deposition reducing by two orders of magnitude from 53.6 to 0.4 kW as the
radius increases from 1.35 to 2 m and the shield thickness increases from 0.32 to 0.61 m.
At the same time the fusion power reduces only slightly from 175 to 161 MW and the toroidal field at the major
radius of the plasma is reduced from 3.7 to 2.6 T. The maximum field on the superconductor increases slightly
from 24.7 T to 25.9 T. The decrease in power deposition is well represented by an exponential decrease
with a 1/10 decrease every 0.307 m shown by the open black squares.
There are many other important input variables whose effect on the power deposition into the centre column
may be evaluated using the System Code. Examples of such results are given in figure 10 which shows the
power deposition plotted against the relative changes of aspect ratio, fusion gain, elongation, triangularity, density and
beta limit fractions.
Each of the variables starts from the assumed reference conditions of the pilot plant.
At each point the wall loading is adjusted to give the reference Petty[7] H factor of 1.5733.
It is seen that the power deposition is decreased by increasing the elongation or beta limit fraction, and reduced
by increasing the aspect ratio or the fusion gain. It is little changed by changes in triangularity or the density limit fraction.
Of these the greatest effects are from reducing the aspect ratio and increasing the elongation - two factors which
tend to go together naturally.
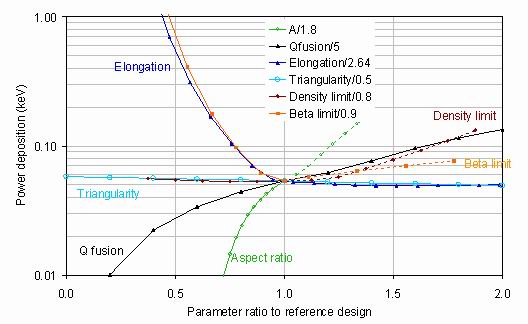
Figure 10. The power deposition into the superconducting core, for several input parameters of the System Code
as a function of the ratio to their values for the proposed pilot plant with plasma radius of 1.35 m. At each point
the The Petty[7] H factor is fixed at the value 1.573 by varying the wall loading. All other input parameters have the
values given in table 1, except where adjusted to give the appropriate density and beta limits. Configurations
where these limits are exceeded are shown dashed.
7. Conclusions
Earlier calculations of the power deposition into the core of a superconducting tokamak using the MCNP code
have been extended to optimise the design of the neutron shield and to include several engineering details.
They suggest an optimal neutron shield could be a mixture of tungsten carbide layers with intervening water-cooling
layers with about 17% of water. The water layer thickness has been optimised: too thin a water layer gives
insufficient moderation, too thick gives insufficient gamma attenuation. The layer radial spacing has been optimised:
a thicker spacing close to the core gives moderation where it is needed, while a thinner spacing next to the plasma
gives better gamma shielding. Shield materials have been optimised: the inclusion of tungsten boride into a tungsten
carbide shield is shown to give appreciably lower power deposition, especially in the layer next to the core.
Next to the superconducting core the water layers should be thicker, and neutron absorbing tungsten boride becomes
advantageous compared to tungsten carbide. The results have been modelled and incorporated into the
Tokamak Energy System Code as a step towards the optimisation of the physics and engineering of a pilot plant.
For example the Petty[7] scaling H factor required for a given fusion gain is shown to drop rapidly with plasma radius
at constant deposited power, but less rapidly at constant core size, and to become almost independent of radius
at constant fusion power. Maintaining the Petty[7] scaling H factor at a constant reference level of 1.563, it is shown
that the power deposition decreases by two orders of magnitude as the major radius increases from 1.35 to 2.0 m.
Under similar conditions it is shown that the deposited power rises with superconducting core radius, aspect ratio
and fusion gain but falls with increasing elongation and beta limit fraction. It is not strongly dependent on the
triangularity or density limit fraction.
The results presented here suggest that a relatively inexpensive spherical tokamak of 1.35 m radius would
have a 53 kW power deposition into its superconducting core. This could be extracted by a feasible cryogenic
power of 2.8 MW. Reducing the plasma radius at constant superconducting core radius and aspect ratio puts
up the cryogenic costs, while increasing it puts up the cost of the superconducting tapes and general engineering costs.
However other factors, such as mechanical stress and diverter load, outside the scope of this paper, could
change the optimal radius. Another uncertainty is the effect of radiation damage on the superconductors, which
may require the deposited power to be appreciably decreased. Our results suggest that each increase of shielding
thickness by 0.307 m reduces the power deposition by an order of magnitude.
References
[1] C G Windsor, J G Morgan and P F Buxton, "Heat deposition into the superconducting central column of a spherical tokamak fusion plant", Nuclear Fusion 55, 023014, (2015)
[2] A E Costley, J Hugill and P F Buxton "On the power and size of tokamak fusion pilot plants and reactors", Nuclear Fusion 55, 033001, (2015)
[3] T. Goorley, M. James, T. Booth, F. Brown, J. Bull, L. J. Cox, J. Durkee, J. Elson, M. Fensin, R. A. Forster, J. Hendricks, H. G. Hughes, R. Johns, B. Kiedrowski, R. Martz, S. Mashnik, G. McKinney, D. Pelowitz, R. Prael, J. Sweezy, L. Waters, T. Wilcox and T. Zukaitis, "Initial MCNP6 release overview", Nuclear Technology, 180, 3, 298-315, (2012)
[4] C M Carney, T A Parthasarathy and M K Cinibulk, "Oxidation resistance of hafnium diboride ceramics with additions of silicon carbide and tungsten boride or tungsten carbide", J. Am. Ceram. Soc., 94, no. 8, 2600-2607, (2011)
[5] W G Fahrenholtz and G E Hilmas, "Oxidation of ultra-high temperature transition metal diboride ceramics", International Materials Reviews 57, 61-72, (2012)
[6] T Brown, J Menard, L El-Gueblay and A Davis, "PPPL ST-FNSF Engineering Design Details", Fusion Science and Technology, 68, 277-281, (2015)
[7] C C Petty, "Sizing up plasmas using dimensionless parameters", Phys. Plasmas 15, 080501, (2008) http://scitation.aip.org/content/aip/journal/pop/15/8/10.1063/1.2961043
[8] R Prokopec, D X Fischer. H W Weber and M Eisterer, "Suitability of coated conductors for fusion magnets in view of their radiation response", Superconductor Science and Technology, 28, 0953-2048-28-1-014005, (2015)
[9] A E Costley, "On the fusion triple product and fusion power gain of tokamak pilot plants and reactors", Nuclear Fusion 56, 066003, 2016
[10] H R Wilson, "SCENE - simulation of self-consistent equilibria with neoclassical effects", UKAEA-FUS 271 (1994)
.
Appendix: Engineering extensions to the superconducting core design
This appendix first considers the three engineering extensions to the shield design illustrated in figure 1.
These have been evaluated in a series of MCNP computations around the reference point
(R0=1.35 m, rsc=0.2 m, dshield=0.32 m).
The first is the thickness of the vacuum gap dvac needed to insulate the cold superconducting core from the
neutron shield. Table A1 shows the raw results for the power deposition into the superconducting core for vacuum gaps
from zero to 0.06 m. These results include no tie-bar or plasma-wall gap. Outside the vacuum gap is an enclosing neutron
shield which is changed in thickness to maintain the total thickness of the centre column constant.
Table A1. The power deposition into the central core of a pilot plant design with R0=1.35 m major radius and a
superconducting core radius rsc=0.23 m as a function of the vacuum gap thickness dvac. The neutron shield thickness
dshield changes to keep the core radius constant.
| dvac (m) | 0 | 0.01 | 0.02 | 0.03 | 0.04 | 0.05 | 0.06 |
dshield(m) | 0.37 | 0.36 | 0.35 | 0.34 | 0.33 | 0.32 | 0.31 |
Ptot(MW) | 0.0295 | 0.0346 | 0.0405 | 0.0472 | 0.0552 | 0.0638 | 0.0745 |
The crosses in figure A1 show these data and the full line the prediction of the System Code given by adding
the term DlogePtot = 1.53 * (dvac(m) - 0.03) in MW units to equation 1.
The power deposition variation is close to exponential and so appears linear on a log plot.
The small vertical displacement arises because the superconducting core radius rsc was 0.23 m rather than 0.20 m.
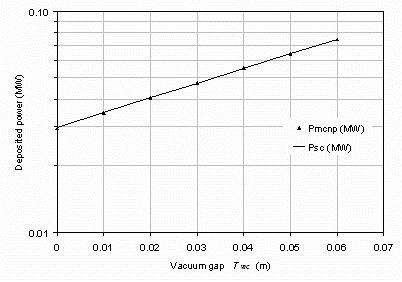
Figure A1. The deposited power into a central
superconducting core as a function of the vacuum gap
thickness dvac between the superconducting core and the neutron shield. The triangles are MCNP computations
and the curve is the analytic fit incorporated into the Tokamak Energy System Code.
A second engineering addition was to evaluate the effect of a Eurofer steel tie-bar of radius rtie
at the centre of
the superconducting core. This was computed for rtie ranging up to 0.07 m.
The thermal vacuum gap dvac was
0.03 m. In order to keep the cross-sectional area of superconductor constant, the thickness of the
superconducting core is increased slightly (by less than 0.01 m) and the extra space taken from the vacuum gap.
The power deposition increase is relatively small (~5%) over the range as shown in table A2.
Table A2. The power deposition into the central core of a pilot plant
design with R0=1.35m major radius as a function of the tie-bar radius.
The superconducting core radius changes to make the core area constant and the extra space is taken up by
a reduction in the vacuum gap thickness.
| rtie (m) | 0.00 | 0.03 | 0.04 | 0.05 | 0.06 | 0.07 |
rsc (m) | 0.1936 | 0.1960 | 0.1977 | 0.2000 | 0.2030 | 0.2059 |
dvac (m) | 0.0364 | 0.0340 | 0.0323 | 0.0300 | 0.027 | 0.0241 |
Pcore (kW) | 0.0519 | 0.0517 | 0.0516 | 0.0514 | 0.0515 | 0.0514 |
Ptie (kW) | 0.0000 | 0.0006 | 0.001 | 0.0015 | 0.0021 | 0.0028 |
Ptot (kW) | 0.0519 | 0.0522 | 0.0526 | 0.0529 | 0.0536 | 0.0542 |
The power depositions into both the tie-bar and the rest of the superconducting core were evaluated separately
but the power deposition into the tie-bar was only some 3% of the total for a tie-bar radius of 0.05 m.
In figure A2 the triangles show the total power deposition from the tie-bar plotted against the square of the tie-bar radius.
Note the greatly expanded vertical scale. The actual change in power deposition on including a 0.05m radius tie-bar
is only about 2% so that the tie-bar, with its comparatively small cross-sectional area, does not make an important contribution.
The line in figure A2 shows the System Code prediction with the addition of a term
DlogePtot=0.013+ 4.03*rtie(m)2 in MW units to equation 1.
The deviations are small in absolute terms and are probably caused by Monte Carlo statistical errors.
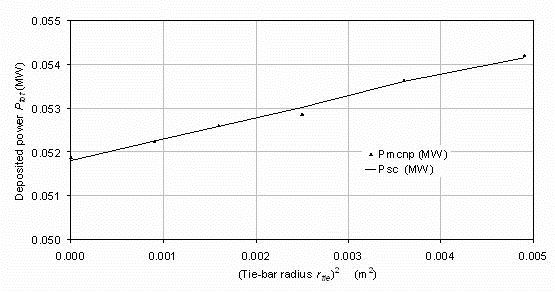
Figure A2.
The deposited power into a central superconducting core as a function of the square of the radius of
a steel tie-bar placed at the centre of the superconducting core. The triangles are MCNP computations and the
curves are from the analytic equation incorporated into the Tokamak Energy System Code.
Plotted against the square of the tie-bar radius the fit is roughly linear but the changes are small and so are
probably affected by statistical error.
A third engineering addition to be considered is the plasma-wall gap. This includes the tokamak "first wall"
with any vacuum vessel and plasma-facing tiles needed to withstand the presence of the plasma.
No further MCNP runs need to be done for this addition, since its space may taken up by a reduction in the neutron
shield thickness.
Another important engineering question is the vertical distribution of the power deposition into the superconducting core.
The concentration of the neutron production near the mid-plane of the plasma means that the power deposition
into the core is concentrated here too and it is important to know the form of the vertical profile of the power deposition.
The previous study [1] analysed the power deposition into just the centre and the outer regions. The present study
extends this to 11 regions as shown in table A3.
Table A3. The 11 vertical segments into which the power deposition was divided.
The figures are for a fusion pilot
plant of major radius 1.35 m and a vertical extent of +/-2.37 m.
| Segment | Vertical range (m) | Mean height (m) | Thickness (m) |
| 1 | -2.37 to -2.00 | -2.185 | 0.37 |
| 2 | -2.00 to -1.55 | -1.775 | 0.45 |
| 3 | -1.55 to -1.10 | -1.325 | 0.45 |
| 4 | -1.10 to -0.65 | -0.875 | 0.45 |
| 5 | -0.65 to -0.20 | -0.425 | 0.45< |
| 6 | -0.20 to 0.20 | 0 | 0.40 |
| 7 | +0.20 to + 0.65 | 0.425 | 0.45 |
| 8 | +0.65 to +1.10 | 0.875 | 0.45 |
| 9 | +1.10 to +1.55 | 1.325 | 0.45 |
| 10 | +1.55 to +2.00 | 1.775 | 0.45 |
| 11 | +2.00 to +2.37 | 2.185 | 0.37 |
As in earlier computations the superconducting core was 0.2 m in radius and simplified to represent a uniform
density of a mixture of Hastelloy and copper with 25% by volume of liquid neon cooling, around a 0.05 m radius steel tie rod.
The neutron shield was of total thickness 0.32 m and composed of 5 equal layers of shield
(tungsten or tungsten carbide alloy) 0.052 m thick, and 4 layers of pure water 0.015 m thick.
Since the plasma is vertically symmetric, the sectors at equal distances from the mid-plane should give similar results,
but the statistical nature of Monte Carlo calculations means that the results are not exactly symmetric.
The two outer segments are actually within the top and bottom shields.
Table A4. The parameters of the 12 ellipsoidal toroids describing the plasma neutron production profile. The
figures are for a fusion pilot plant of major radius 1.35 m and include the plasma major and minor radii,
vertical height and normalised intensity.
| Shell | Major radius R0 (m) | Minor radius a (m) | Vertical height b (m) | Intensity I |
|
| 0 | 1.5815 | 0 | 0 | 1 |
| 1 | 1.581 | 0.0625 | 0.1434 | 0.9386 |
| 2 | 1.577 | 0.125 | 0.287 | 0.776 |
| 3 | 1.5696 | 0.1875 | 0.4313 | 0.5651 |
| 4 | 1.5589 | 0.25 | 0.5765 | 0.3625 |
| 5 | 1.5447 | 0.3125 | 0.722 | 0.2049 |
| 6 | 1.5271 | 0.375 | 0.8681 | 0.102 |
| 7 | 1.5061 | 0.4375 | 1.0155 | 0.0447 |
| 8 | 1.4817 | 0.5 | 1.1665 | 0.0173 |
| 9 | 1.4539 | 0.5625 | 1.3255 | 0.0059 |
| 10 | 1.4227 | 0.625 | 1.4992 | 0.0018 |
| 11 | 1.388 | 0.6875 | 1.6974 | 0.0005 |
The plasma description, as superposed toroids of elliptical cross section, was enhanced to describe more
accurately the vertical distribution of neutron production. The revised description included 12 toroids whose
description follows SCENE code computations [10], and approximates the Miller description with four parameters,
major radius (R0), minor radius (a), vertical radius (b) and intensity (I),
for each shell.
These parameters are shown in table A4. The first "zero" shell is only used for illustration as it has no volume,
and it is seen that the last five shells have very low intensity compared to the first six.
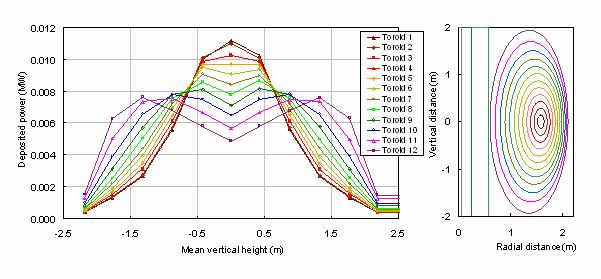
Figure A3.
The power deposited into the cryogenic tie-bar and superconducting core plotted against the mean
vertical height as a function of the elliptical cross section toroid number with a tungsten carbide alloy shield with water cooling.
The corresponding elliptical cross sections are shown on the right.
MCNP computations were performed for each of the toroidal volumes described by the spaces between toroidal surfaces.
Combined with an assumed radial intensity profile, this enables the three-dimensional neutron production profile to be defined.
The raw MCNP results are expressed as the energy deposited per fusion neutron produced per gram of target material
for each vertical segment, and also for the three volumes of the tie-bar, superconducting core and shield.
For the present purposes we consider the total power deposition summed over the tie-bar and core volumes,
which defines the cryogenic power removal requirement.
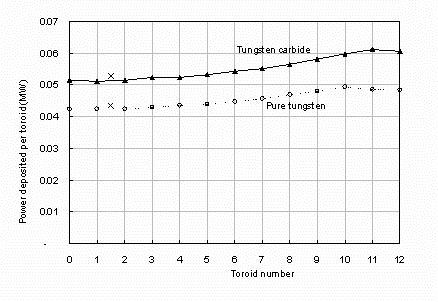
Figure A4.
The power deposited into the tie-bar and superconducting core for each of the 12 toroidal sections
defined in table 5 for tungsten carbide (triangles) and pure tungsten (open circles) shields with water cooling.
The crosses show the composite total power deposition when all sectors are summed with the appropriate area
and intensity values.
Figure A4 shows these deposited powers for each of the volumes between the elliptical cross section toroids,
as a function of the outer toroid number, for a tungsten carbide alloy and shield with water-cooling.
The first three inner toroids give a Gaussian-like distribution, but the larger toroids show a double-peak distribution.
The areas under the curves of figure A3 representing the total energy deposition per neutron produced varies by only
about 10% as shown in figure A4. Because of the concentration of the neutron production into the first few toroids
these have by far the greatest influence, and the crosses in figure A4 show the total energy deposition evaluated
by a summation weighted by area and neutron intensity. It is seen that they are within 3% of the power deposition
from just the first toroid. Elsewhere in this paper the approximation of using just this central toroid has been adopted.
The vertical distribution of power deposition is calculated by multiplying the deposited powers for each vertical
section as shown in figure A3 by the relevant toroidal volumes and the normalised neutron intensities from table A4.
Because the sectors are of different heights they must be expressed as power deposition per metre as shown by
the solid triangles for tungsten carbide in figure A5. The open circles in figure A5 shows a similar computation
with identical geometrical sizes but using pure tungsten instead of tungsten carbide alloy in the neutron shield.
The height distribution is seen to be very similar but the deposited power is only 83% of that from the tungsten carbide
alloy
For modelling purposes, the distributions in figure A5 are quite well fitted by the Gaussian distribution shown by the
dashed line whose full width at half height is 2 m.
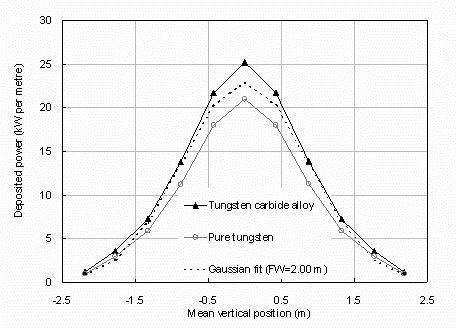
Figure A5.
The total power deposition per unit length into the tie-bar and superconducting column as a function of the mean
vertical position of the segments. They are shown for the tungsten carbide alloy and for a similar computation
with the same geometry but using pure tungsten and water in the neutron shield. The distributions approximate to
the Gaussian function shown dashed with a full width at half height of 2 m.