From NDT INTERNATIONAL OCTOBER 1981
Measurement of internal stress within bulk materials using neutron diffraction
A. Allen, C. Andreani, M.T. Hutchings and C.G. Windsor
Neutron diffraction measures stress through the small changes in atomic lattice parameters caused by strain. The method is similar to X-ray diffraction with the vital difference that a thermal neutron beam penetrates several centimetres in most materials allowing measurements within bulk samples. Ways of achieving the high resolution necessary for quantitative measurements are described. Results are presented for the strains in a mild steel bar subjected to known elastic stresses, and on the internal stresses in a deformed bar.Introduction
The absolute measurement of internal stress within bulk components
currently poses a major problem in the field of non-destructive testing
as none of the existing methods provide unambiguous data1. For example
ultrasonic methods measure lattice strain through its effect on the sound
velocity, but this is also affected by preferred orientation
or texture in the sample 2. X-ray diffraction measures strain
directly but can only measure essentially the surface strain
since, in the diffraction method, X-rays penetrate only a
few tens of microns into typical metals3. Many magnetic
measurements are functions of strain but none are functions of strain alone.
The neutron diffraction method4 measures strain directly
through changes in the lattice spacing as in X-ray diffraction,
and is essentially unaffected by other sample properties
such as texture. Because of the neutrons' ability to penetrate
inside bulk materials we believe it is likely to become an
important technique for internal stress measurement.
However its drawback is that high resolution is needed,
and neutron beams of sufficient intensity are only available
at reactors or accelerator-based neutron sources. Samples
may be transported to the neutron beam, but conventional
methods must still be used on the factory floor.
In the following sections we outline the principles of the
neutron diffraction technique for measuring internal stress.
We then describe two different diffractometers with sufficient
resolution to measure the internal strains in steels.
We then describe measurements on a 6 mm (1 in) mild
steel bar subjected to defined external stresses below its
elastic limit. Lastly we describe measurements of the
internal stress in a 25 mm (1 in) thick bar deformed beyond
its elastic limit.
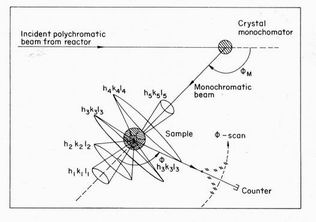
Fig. 1 Neutron powder diffraction.
Neutrons of a particular wavelength are selected from the reactor beam by reflection from a crystal
monochromator. A polycrystalline sample contains grains of all
orientations which scatter at different angles
fhkl according to their
plane spacing dhkl. The scattering cones are intercepted by scanning
the counter angle f.
The neutron diffraction technique
Neutron beams from reactors have a wavelength of the
order of 0.1 nm (1 Ǻ) - similar to that of an X-ray beam. ,:
They differ from X-rays in interacting only weakly with
matter and so penetrate several centimetres in most materials.
A neutron beam monochromated to a particular wavelength
l
is diffracted by a polycrystalline material into a
series of cones as shown in Figure 1. The scattering angles
fhkl
of these Debye Scherrer cones measure the lattice
spacings d^ of the various atomic planes with Miller
indices hkl.
The scattering angles are related to the d
spacings through Bragg's law;
l = 2dhkl
sin(fhkl/2).....(1)
An internal stress causes a strain which changes the lattice
spacings d by a tiny fraction
ld/d, of magnitude a few
times 10-4, which must be deduced from the consequential
changes Df in scattering angles.
Most conventional neutron
diffractometers have insufficient angular resolution to resolve
such small changes. The possible ways of improving the
sensitivity are made clear by differentiating Equation 1.
Dd/d =
Dl/
l +
cotf/2 +
(Df/2) .....(2)
As the angle f increases
towards back scattering (f = 180o)
the term cotq reduces to zero,
and can therefore be made
small with consequent improvement in resolution.
Alternatively the angular resolution Df
can be improved, for
example by defining the beam by multi-slit Soller collimators,
but this results in a proportionate loss in intensity.
In order to reduce the contribution of the Dl/
l term in
Equation 2, we consider the usual method of monochromating
neutrons by Bragg reflection from a large single
crystal as in Figure 1. The wavelength is determined by the
monochromated beam angle fM
and the spacing dM of the
crystal planes held at the appropriate orientation. The
wavelength resolution term is then
Dl/
l =
cotfM/2 +
(DfM/2) .....(3)
High resolution is obtained either by going to high angles
fM
or by improved collimation. Of the two diffractometers
we describe, one uses scattering angles within the
range 5o to 10o from back scattering in both
fM and
fhkl(j) to
obtain the necessary resolution without exceptional collimation.
The other uses high angles of order 110o coupled
with high (10') collimation.
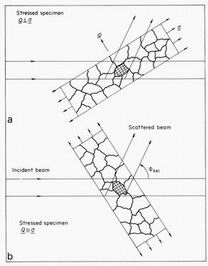
Fig. 2 A diffraction experiment selects crystallites with lattice
planes perpendicular to the direction Q at the orientation appropriate
for Bragg reflection at the scattering angle
f. (a) If the sample is
placed with the stress perpendicular to Q, contracted plane spacings are observed.
(b) If the stress is parallel to Q, the plane spacings are expanded
The detection of the lattice strain tensor by
diffraction
Figure 2 shows schematically a large, stressed, polycrystalline
sample placed in the sample position of a
neutron diffractometer. Of all the grains in the sample
only those whose lattice planes are oriented to allow Bragg
reflection will contribute to the scattered beam. Bragg
reflection occurs when the normal to the reflecting planes
bisects the incident and scattered neutron beams and is
therefore parallel to the change in neutron wave vector,
conventionally denoted as the scattering vector Q.
If the direction of the stress
s
in the sample lies along Q, (Q ||s )
the appropriate lattice spacings will be slightly increased. If it
lies perpendicular to it the same lattice spacings
will be slightly contracted because of the Poisson's ratio
effect in the bulk material acting on each crystallite.
By rotating the specimen in the diffractometer and
measuring the d spacing shift as a function of orientation,
the principal axes of the strain tensor can be determined.
(Shear strains giving the off-diagonal terms in the strain
tensor have different effects.) The stress can then be
calculated from the strain knowing the elastic moduli from
bulk measurements.
Figure 2 also illustrates how a relatively thin incident and
scattered neutron beam can be used to define a precise
volume within a large bulk specimen and so measure stress
as a function of position over the specimen volume. The
volume is best defined when
fhkl is around
90o, and least well defined in the back scattering geometry.
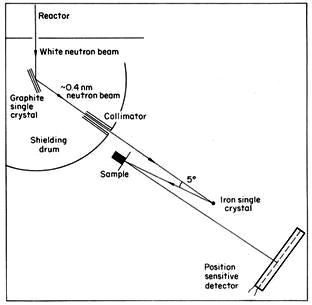
Fig. 3 The Double Back Scattering Diffractometer
The Harwell double back scattering diffractometer
Figure 3 shows the layout of the double back scattering
(DBS) diffractometer at Harwell with which residual stress
effects were first observed. The diffractometer was modified
from the MARX spectrometer on the PLUTO reactor. A
preliminary crystal monochromator of pyrolitic graphite
selects a roughly monochromatic beam of about 0.4 nm
wavelength. Selection of a very narrow wavelength band is
then achieved by Bragg reflection from a single crystal of
pure iron aligned so as to reflect from its 110 planes at a
scattering angle
fM= 174.15o corresponding to 5.84o from
back scattering. An iron crystal was chosen since the use of
back scattering from both monochromator crystal and
sample implies a match between the d-spacings dM and
dhkl which is in practice only achieved by choosing the
same plane of the same material. Iron or ferritic steel
samples can then be placed in the beam reflected from
the iron single crystal and the 110 powder reflection
observed. Scattered neutrons are detected by a position-
sensitive detector covering an angular range of about 3o to
28o. No special collimation is used, but the size of an
8-mm-wide beam between the iron single crystal and the
sample gives a geometric collimation
a1~= 0.9o. The
counter resolution of 6 mm together with an 8 mm wide
sample gives a scattered beam geometric collimation
a2 ~ 0.5o.
The resolution calculated using Equations 2 and
3 (and so neglecting any focussing4 considerations) is then
Dd/d ~ 0.5 x 10⁻³.
Collimation in the vertical plane is
determined by the heights of the iron single crystal,
sample and counter, all of which are about 40 mm. This
degree of vertical collimation gives a negligible contribution
to the resolution.
In fact all the samples of iron or steel investigated gave
widths appreciably larger than this calculated resolution.
Even a sample of iron powder, strain-annealed by heating
to 550oC for one hour, gave a width
Dd/d ~ 1.5 x 10.
Our annealed steel bar 5 mm thick gave a width
Dd/d ~1.8 x 10⁻³.
Such widths can be due to microscopic
internal stresses within a single grain of the material, such
as those caused by dislocations or defects within the grain,
or from microscopic stresses varying randomly from grain
to grain produced by, say, an impurity phase. This micro-
scopic stress can be measured by diffraction only after
deconvolution of a term
Dd/d ~
l/2L
depending on the
size L of the diffracting crystallites. The macroscopic strain
spans several grains of a material and so gives a uniform
shift to the peak angle rather than a width. The minimum
detectable shift, which determines the minimum detectable
stress, is typically at least 1/10 of the width of the observed
peak. The actual value depends on the statistics of the
measurement and the degree to which the line-shape is
well-defined.
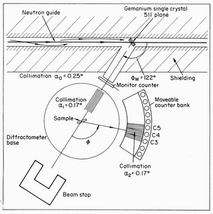
Fig. 4 The modified D1A spectrometer
at the ILL reactor. The high
resolution
Dd/d ~ 1.4 x 10⁻³ at 109�
is achieved by relatively high
monochromator and scattering angles, by multislit Soller collimators
before and after the sample, and by employing a 'focussing' configuration
with
f~
fhkl.
Counter 4 was used for all peaks, counters 3 and
5 were used to estimate the background
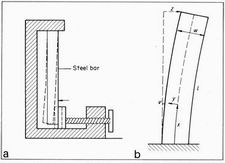
Fig. 5 (a) The modified vice used to apply a quantitative stress to
a mild steel bar. The bar was clamped at its upper end, and displaced
at the vice jaw by turning the screw thread, (b) shows the variables
used in defining the stress
f(x, y) as a function of position on the bar
The modified high-resolution powder diffractometer
The powder diffractometer D1A is situated on a thermal
guide tube from the high-flux reactor at the Institut Laue-
Langevin at Grenoble. It was already noted for its high
resolution5. Its layout is shown in Figure 4. The guide tube
gives an effective collimation
a0= 0.25o for 0.19 nm
neutrons. This is convoluted with the mosaic spread of the
germanium monochromator to give a beam on the sample
with angular divergence 0.67o. Scattered neutrons are
selected by ten Soller collimators of divergence
a2= 0.17o,
each in front of a counter separated by 6o. This configuration
gave a resolution at
f = 109o of
Dd/d = 1.6 x 10⁻³ as
measured from a strain-free alumina specimen. The resolution
was further improved by the addition of a further
Soller collimator giving a divergence between the mono-
chromator and sample
f=0.17o. This increased the
measured resolution at f= 109o to
Dd/d = 1.39 x 10⁻³M/d,
marginally less than the resolution calculated using Equations 2 and 3
because, near this scattering angle, focussing
effects are appreciable. With this diffractometer, scans must
be made by changing the scattering angle
f in small steps.
We concentrated most measurements on the iron 311 powder
peak as this came near f = 109o,
allowing focussing effects
to be exploited in improving the resolution. Only one
counter could be used effectively for the scan. The counters
6o on either side were used to estimate a background, although
this was typically only a percent or two of the peak.
Stress measurements in mild steel bar bent elastically
As a test of the method, an extensive series of measure-
ments was performed on a bar of low-carbon mild steel
which could be deformed to a known degree below its limit
of elasticity. The bar had a thickness t=6 mm (1/4 in) and
width w = 51 mm (2 in) and had been heat treated for one
hour at 550oC to remove residual stresses. (The first measurements
were performed on a similar bar of just half the
thickness and width.)
The strain was applied as shown in Figure 5. One end was
firmly clamped, while the other end could be displaced by
distances z by rotation of a vice screw.
The length of the bar between the clamp end and the top
of the vice was l = 214 mm. It had been hoped to measure
the stress directly from the displacement z. The stress
s(x, y) at a position x
from the clamp and y from the
neutral axis would then be given in terms of Young's modulus
E by
s(x, y) = 3E z(l-x)y/l3 ....(4)
This formula failed if z was measured from the vice displacement
as distortions of the clamp occurred. Instead the
curvature of the bar was measured directly by measurements.
of the profile of the bar under various nominal stresses. The
stress is then given simply from the curvature d2 v/dx2 by
s(x, y) = -yEd2 v/dx2 ....(5)
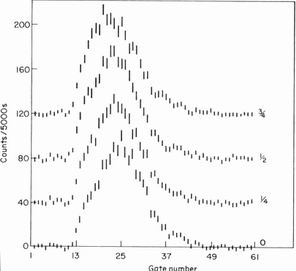
Fig. 6
Scans of the counts recorded by the position-sensitive
detector as a function of the detector gate number. One gate
corresponds to a 1.6 mm displacement and to 0.06o in scattering
angle. The different curves correspond to 0, 1/4, 1/3, and 3/4 turns of the
screw thread of the vice
Profile measurements were performed by mounting the bar
horizontally on a plane table and traversing a height gauge
over the top surface of the bar. Although the height accuracy
was better than 10-2 mm, the need to differentiate
twice led to an appreciable possible error in the calibration
of stress of perhaps 30%. The maximum stress occurs on
the edge of the bar (y = w/2) and near the clamped end
(x = 0). Taking Young's modulus for steel as E = 207 x 109 Pa
(30 x 106 lbf/in2) gave a maximum stress at our largest
nominal displacement of 137 MPa. This is not far below
the yield stress 250 MPa. In fact our smaller bar emerged
from any further displacement with a permanent set at the
clamped end. No observable deviations from elastic behaviour
occurred in our larger bar.
Figure 6 shows experimental results made using the
Harwell DBS diffractometer. The curves are plotted against
channel number of the position-sensitive detector as a
function of the nominal applied stress in turns of the vice
screw. For these data the bar was aligned vertically so that
the normal to the Bragg reflecting planes was perpendicular
to the stress. The actual displacement of the bar was only a
few millimetres and, being along the back scattering direction,
produced no significant effect on the scattering angle.
The displacement due to stress is clearly seen and was
evaluated from the centroid of the peak profile together
with its statistical error. The shifts relative to the unstressed
position were converted into a relative shift
Dd/d
in lattice
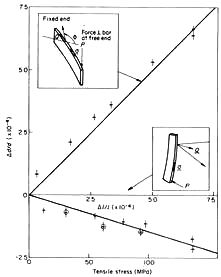
spacing using Equation 1. The circled points in Figure 7
are these values plotted against the stress calculated for this
region of the bar using Equation 5. The shift is a negative
one as expected for the Q i a geometry of Figure 2.
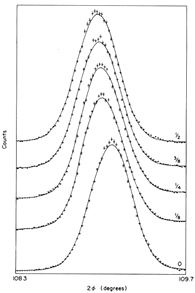
Using the D1A diffractometer it was possible to orient the
bar so that reflecting planes with normals Q either parallel
or perpendicular to the stress direction a could be observed.
Examples of the data for Q perpendicular to
s are shown in Figure 8. The
actual linewidth corresponds to
Dd/d ~ 2.3 x 10⁻³ and is
appreciably larger than the resolution of 1.4 x 10⁻³. The
lineshape is seen to be close to Gaussian. The peak position
was deduced from a least squares fit of the data to a
Gaussian of variable intensity and width. The total run
time for a scan on both diffractometers was about 10
minutes.
The uncircled points in Figure 7 shows the shifts
Dd/d from
the D1A data plotted against the stress
s(x, y) averaged
over an 8-mm-wide strip near the edge of the bar (x = 30 mm,
y = 48 mm). The upper points correspond to the
Q parallel to the stress
configuration and show positive shifts with a magnitude
about three times as great as the lower points which have negative
shifts measured in the Q perpendicular to
d configuration.
The cental scale to Figure 7 shows the macroscopic strain
Dl/l=0.5wd2v/dx2 ....(6)
calculated from the curvature measured at the experimental points. The upper
line has a slope of unity showing that the macroscopic extension is roughly equal to
the microscopic extension as measured from the lattice spacings.
The lower line has a slope of -0.30. This shows that the microscopic Poisson's ratio
is again roughly equal to the macroscopic Poisson's ratio for steel of 0.30.
Fig. 7 Fractional change in lattice spacings vs stress applied for the
mild steel bar. In the upper graph the Q vector is parallel to the direction
of applied tensile stress a which produces macroscopic strain
Dl/l. Thus the lattice strain
Dd/d is positive and approximates closely
to the macroscopic strain (straight line). In the lower graph the Q
vector is perpendicular to the tensile stress direction and so t^d/d is
negative. The straight line assumes Poisson's ratio is -0.30. The
insets show the scattering geometry
-------------------
Fig. 8 D1A Data Scans with Q vector along the stress direction
for 0, 1/8,1/4,3/8, 1/2 turns of the vice-screw
The slopes of the lines define for us the calibration of the
stress for mild steel in terms of d spacing shifts, and we may
go on to measure stresses in other mild steel samples from
the measured shifts.
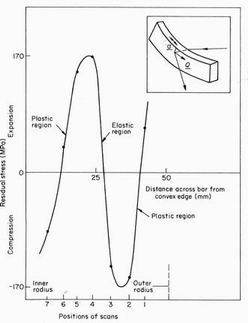
Residual stress measurements in a plastically
deformed bar
A second series of measurements was made on a mild steel
bar of 25 mm (1 in) thickness, and 51 mm (2 in) width which
had been subjected to sufficient stress to bend it beyond its
elastic limit into a permanent curve of radius about 500 mm
across the 51 mm width. It therefore contained large residual
strains up to and beyond the elastic limit. It was placed on
the D1A diffractometer with the reflecting planes along the
bar. The magnitude of the stress across the width of the bar
was measured by raising the bar across the incident beam
narrowed by slits to 7 mm height. The results are shown in
Figure 9. They have been converted into stresses from the
calibration curve given by the slope of the upper line in
Figure 7. The bar clearly contains an elastically deformed
central region although the neutral axis does not coincide
exactly with the bar axis. The outer regions contain the
plastically deformed metal.
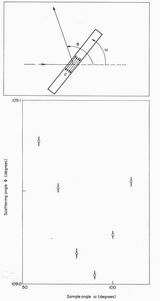
The orientation of the residual strain was measured experimentally
for a position 13 mm from the strained edge of
the bar by performing scans as a function of the angle o
shown inset in Figure 10. The position of maximum shift
Dd/d defines the
strain direction to lie along the bar to
within an accuracy of a few degrees.
Fig. 9 Variation of residual stress with position across the deformed steel bar
Fig. 10 The Bragg scattering angle from the plastically deformed
bar plotted against the angle of the sample near the position (at 90o)
when plane spacings perpendicular to the bar were being measured.
The minimum near 90o shows that the stress lies along the direction
of the bar
Conclusions
High-resolution neutron diffraction gives a measure of
internal stress within bulk materials of up to several
centimetres thickness which can be calibrated absolutely
and is not affected by texture or sample surface. Measurements
take about 10 minutes on the two diffractometers described.
However, the method is restricted to samples
that can be taken to a neutron source of reasonably high
flux. The sensitivity for samples free of microscopic strain
is as high as a few percent of the elastic limit strain, but this
sensitivity is reduced for samples whose microscopic strain
is large.
Acknowledgements
The authors are grateful to Vie Rainey from Harwell and
Steve Heathman of Grenoble for help with the apparatus
and to Colin Sayers for useful discussions. Crown Copyright
is reserved on this paper, Copyright HMSO 1981.
References
1 James, M.R. and Buck, 0. Critical Rev Solid State Mater Sci
9(1980) pp 61-105
2 Cooper, W.H.B., Saunderson, D.H., Sayers, C.M., Silk, M.G.
'Ultrasonics and the residual stress measurements problem'
AERE report R-9588
3 James, M.R. and Cohen, J.B. Treatise on Mater Sci and Tech
19A(1980)p 1-62
4 Bacon, G.E. Neutron Diffraction (Clarendon Press, Oxford
1975)
5 Handbook of facilities (Institut Laue-Langevin, 156X,
Grenoble, France)
Authors
Drs Allen, Hutchings and Windsor are in the Materials
Physics Division, AERE, Harwell. Dr Andreani is on
attachment to Materials Physics Division from Frascati,
Rome, Italy. Enquiries about this work should be directed
to Dr C.G. Windsor, Materials Physics Division, Building
418.15, AERE, Harwell, Oxon, 0X11 ORA, UK.