 Unpublished draft for Phys Rev Letters
CLUSTER SHAPE CHANGES DURING THE FIRST STAGES OF PHASE SEPARATION
Colin G Windsor
AEA Technology, B521.2 Harwell Laboratory, OX11 ORA, UK
Small angle neutron scattering from Al-7.5w%Cr-lw%Fe alloys showed evidence for an increasing exponent in the cross section da/do with scattering vector Q during the first stages of aggregation. This variation is now confirmed by a semi-analytic theory describing the early growth and thermal excitations of all possible small clusters. The exponent changes are seen to be caused by an evolution in cluster shape from the diffuse structure of diffussion limited aggreagation, through a planar structure, to the most compact nearly spherical form.
The early stages of aggregation, for example in quenched binary alloys, remains difficult to explore theoretically. The later stages are well described by the classic Ostwald ripening theory of Lifshitz and Slyozov1. The large scale of the aggregation makes it a good approximation to neglect the details of the lattice structure on which the atoms move. Similarly at temperatures close to the ordering temperature, the classic linear theory of Cahn and Milliard2 and its non-linear extensions, such as those of Langer Bar-on and Miller3, permit continuum models to give a good account of spinodal decomposition. Again the discrete nature of the lattice on which the concentration fluctuations form is not of importance. However at quench temperatures well below the ordering temperature, and in the early stages of growth, calculation is difficult since the detailed structure of the clusters on the lattice is all important. Monte Carlo simulation provides a statistical description of this regime4, but not an interpretation. The exact theory for the early stage growth was given in 1935 by the Becker-Doring equations5. These provide a set of simultaneous equations whose variables are the concentrations of every possible cluster geometry. In this work these equations are solved, with few significant approximations, for small clusters of up to 8 atoms. The results reveal a rich new structure of cluster shape changes as a function of time and temperature.
Small angle neutron scattering measures the Fourier transform of the pair correlations, as weighted by the scattering lengths of the nuclei. It gives cluster shape information from the slope of the plot of the logarithm of the scattering cross section against the logarithm of the scattering vector. The scattering from any three dimensional volumetric shape leads to a slope of -4, the Porod law. The scattering from planar objects gives -2 and that from needles, -16. In Fig. 1 is shown the exponent at high Q values from a segregation experiment in a dilute aluminium alloy plotted against the logarithm of the ageing time7,8. In both cases the solute concentration is about 9%, and the agreggation phase has the simple cubic L12 phase within the face-centred cubic host phase. The increase in slope from around 1 to around 4 is clearly seen.
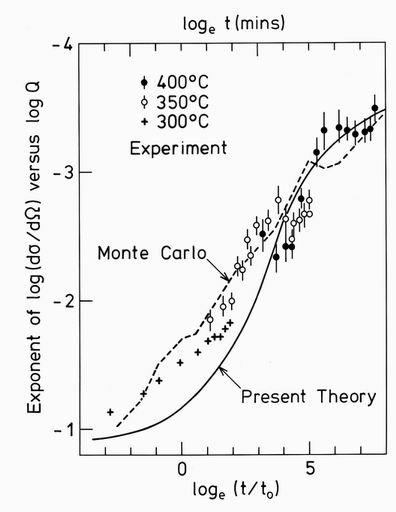
FIG. 1. The exponent of the plot of the logarithm of the small angle neutron scattering cross section against the logarithm of the scattering vector Q at high Q values. Each point represents a fit to a log/log scattering plot measured in situ at the temperature shown. The closed circles are for an Al-7.5w%Cr-lw%Fe alloy7 with different temperatures being used to extend the effective time. The open circles are for an Al-9.5w%Li alloy8. The dashed line is a Monte Carlo computer simulation used to scale the real time to the Monte Carlo exchange time t0. The full line is the present theory with no adjustable parameters.
The term lattice animals is often used to describe the set of all possible clusters lying on a particular lattice and connected by particular bonds. This letter will consider mainly clusters on a simple cubic lattice with near neighbour bonds since this is the structure within the ordered phases of the experiments considered. However the method has also been developed for clusters on a face centred lattice with both nearest and next nearest neighbour bonds, if only to show that, with appropriate interactions, clusters with the simple cubic L12 structure will be formed. Lattice animals have been widely used in the study of the aggregation problem9, particularly within the Eden model10, where clusters grow by occupation of a randomly selected peripheral site. The present extends this model by letting the animals decay by thermal excitation of any of their peripheral atoms. The method thus generalises that of Penrose and Buhagiar 11 which allowed a modified growth rate of the cluster so that detailed balance could be satisfied according to the temperature.
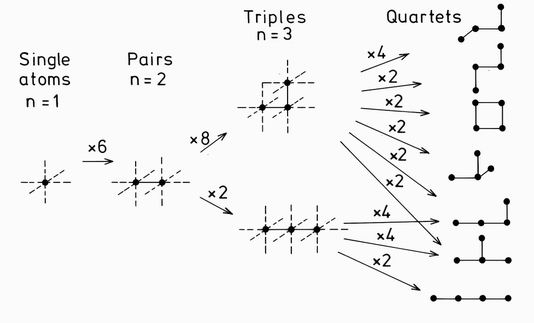
FIG. 2. The growth of clusters of up to 4 atoms. New inequivalent clusters are generated by the attachment of diffusing single atoms to peripheral bonds, shown by the dashed lines. The number of equivalent bonds define the multiplicity of growth to each cluster type, as shown above the arrows.
The equations for the growth and decay of clusters are similar to those of Binder and Stauffer 12 for their approximate solution of the aggregation problem. The system is described by the fractional probabilities fi of finding a cluster of type i on any one site in the lattice. If the number of atoms in the ith cluster type is ni then the cluster probabilities can be normalised to the bulk concentration fc. In the Becker Doring model, growth is assumed to occur through the diffusion of single atoms, whose population is defined by f1. If the diffusion constant is D, then single atoms will be "raining down" onto the peripheral sites of all clusters with the rate 1/6Dfi, the factor 1/6 occuring because of the six possible jump directions in the cubic lattice. Clusters therefore grow as illustrated in Fig. 2 for the 11 clusters of up to 4 atoms. Clusters of type i with n atoms therefore become clusters of type k with n+1 atoms with a rate proportional to both the cluster and single atom fractions, and to the multiplicity of the particular growth mi,k.
Pi,k = 1/6 Dfif1mi,k. (1)
The thermal excitations of each cluster are recorded by considering each peripheral atom in turn, and examining the result of moving this atom to an adjacent unoccupied site. Fig. 3 illustrates this for a particular cluster of n=5 atoms. Excitations include
(i) a cluster of n-1 atoms together with two isolated atoms,
(ii) two pairs together with a single isolated atom,
(iii) a cluster of n-1 atoms together with an isolated atom.
These excitations all increase the total energy, but others may produce a cluster with the same or even a lower, total energy. For example
(iv) an equivalent cluster of n atoms, with the same total energy,
(v) a more compact cluster of n atoms with lower total energy.
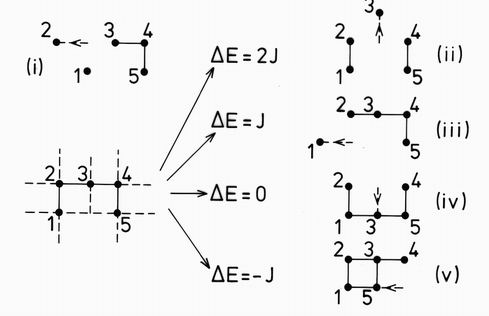
FIG. 3. The thermal decay modes of a particular 5 atom cluster. The dashed lines show the bonds along which atoms may be excited. (The additional bonds out of the plane of the cluster give no new clusters and are not considered in this figure.) The excitations are arranged vertically according to the difference between the final and initial energies DE = Ef -Ei. in units of the bond energy J.
Generally the ith cluster will have ni,f decay modes labelled by f. Each mode will in general produce mi,f,j fragment clusters of type j. The probability of thermal excitation of each mode will be determined by the total energy change, which in the present case, is a function only of the total number of nearest neighbour bonds. If the total energy of the original ith cluster was Ei, and the total energy of all the fragment clusters in the decay mode f is Ef , then the rate of decay of this mode will be proportional to
qf = fi.mi,f,j exp[ - (Ei - Ef)/kT] (2)
The differential equations for the growth and decay of the clusters are
dfi/dt = - S pk - S qf
dfk/dt = + S pk
dfj/dt = + S qf mf,j
dfl/dt = - S pk. (3)
As an example, consider the two coupled equations for the growth of doublets (cluster2) from isolated atoms (cluster 1). If the pair interaction is J, then the equations are
df1/dt = - 2.(D/6) f12 +2.6.exp(J/kT) f2
df2/dt = (D/6) f12 +6.exp(J/kT) f2 (4)
It is seen that the terms occur in equal and opposite pairs, as required to satisfy the concentration sum, which may be written in this case as f1 + 2f2=c.
The computation procedes as in Fig. 2 from the isolated atom cluster up to some maximum cluster size, nmax = 8 in the work being reported. For a given cluster type,
all the empty peripheral sites are selected in turn, and the potential new cluster formed when a new atom is inserted there considered. It may form a new cluster, an equivalent cluster, or one of those already included in the list of distinct clusters. This decision was performed automatically by comparing the following cluster properties, all of which are invariant under transformations of the clusters, and are also needed
later in the analysis of cluster properties:
i) the dimensionality, linear, planar or volumetric.
ii) the set of coordination numbers, oi,k, where k goes from 0 to 6 in this lattice.
iii) the pair correlations ci,r of each cluster i up to some maximum distance rmax.
iv) the cluster radius of gyration squared.
The 12 integers composed of the dimensionality, the 7 coordination numbers, and the
first 4 pair correlations are sufficient to define clusters of up to 4 atoms, and make a
good approximation to even the 8 atom clusters. Table I shows how the number of
clusters, the correlation range, and their modes of growth and excitation, vary with
the number of atoms in the cluster. 4-atom clusters are easily solved. 8-atom clusters
are just tractable on a PC. 16-atom clusters would be intractable.
Table I. For clusters of a given size (nmax), the maximum number of correlations (nc), and the number of distinct clusters (nd). The number of distinct clusters when only 4 correlations are defined (n4} is also shown. In this case the number of distinct growth modes (ng) and excitation modes (ne) are shown.
| nmax | nc | nd | n4 | ng | ne |
| 4 | 6 | 11 | 11 | 12 | 67 |
| 5 | 9 | 34 | 30 | 56 | 470 |
| 6 | 12 | 139 | 86 | 324 | 1145 |
| 7 | 17 | 667 | 231 | 792 | 2461 |
| 8 | 22 | 4000 | 611 | 2568 | 8079 |
From this process a dataset is created giving all the modes of growth and decay of clusters up to some maximum size. A particular set of exchange constants and a temperature may then be defined, and the differential equations for all the cluster fractions evaluated as a function of time for a given set of starting conditions. These fractions are then stored at appropriate intervals, and distributions such as the cluster size, radius of gyration, coordinations and correlations evaluated from the functions already stored for each cluster. Time can be defined as in Monte Carlo calculations in terms of the mean time between atomic exchanges t0= D/6.
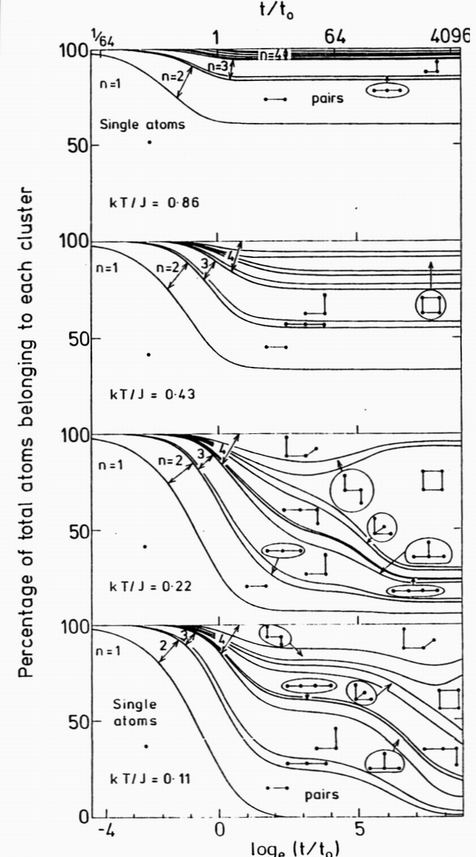
FIG.4. The cumulative distribution of the 11 distinct clusters of up to 4 atoms as a function of time and temperature. The distributions are normalised so that the spacing between each line marks the occupation probability of the cluster type illustrated. Time is shown on a logarithmic scale in units of the Monte Carlo exchange time t0. At a low temperature kT/J=0.11, the clusters are almost stable and form with the probabilites of diffusion aggregation. At a higher temperature, kT/J=0.22 the clusters aggregate at a similar rate but compact so that the "square" cluster becomes dominant. Around the ordering temperature kT/J=0.43 an equilbrium is reached where the growth and decay of clusters of all sizes is balanced. At a high temperature kT/J=0.86 the occupation probabilities rapidly reach an equilbrium where only the smaller clusters have an appreciable occupation.
Much insight into the details of the aggregation process can be found, even from the nmax= 4 equations, which are trivially easy to integrate numerically. Fig. 4 shows for the low volume fraction limit, how the solute atoms in the alloy are distributed among the 11 distinct clusters, as a function of time at several temperatures. At a low temperature, kT/J=0.11, the colliding atoms tend to "stick together", and clusters form by the diffusion limited aggregation process13. The single atom population decreases as single atoms aggregate to produce first pairs, then successively larger clusters. By a time of around 16t0 the single atom population becomes exhausted and at zero temperature the cluster distribution remains fixed at the the fractions determined by the products of the growth multiplicities. At a higher temperature kT/J=0.22, or at longer times, the initial distribution changes as clusters are thermally excited with a probability proportional to exp(-DE/kT according to the energy change DE. Clusters such as the pairs and triangles have a high proportion of singly-bonded atoms. These form an equilibrium flux of mobile single atoms which is in turn absorbed by the other clusters. Clusters with several doubly bonded atoms are preferentially stable. The square is the most stable of all, and at low temperatures will eventually grow to dominate the distribution. At a temperature kT/J=0.43, closer to the order-diefsorder transition, the single atom population remains large and the cluster population rapidly approaches a dynamic equilibium when the growth of each type of cluster is balanced by its decay rate. At kT/J=0.86, above the transition temperature, excited with a probability proportional to exp(-DE/kT) according to the energy change exp(-DE/kT. Clusters such as the pairs and triangles have a high proportion of singly-bonded atoms. These form an equilibrium flux of mobile single atoms which is in turn absorbed by the other clusters. Clusters with several doubly bonded atoms are preferentially stable. The square is the most stable of all, and at low temperatures will eventually grow to dominate the distribution. At a temperature kT/J=0.43, closer to the order-disorder transition, the single atom population remains large and the cluster population rapidly approaches a dynamic equilibium when the growth of each type of cluster is balanced by its decay rate. At kT/J=0.86, above the transition temperature, the larger clusters have only a short lifetime, and only the "short range order" from the population of small clusters is observed.
A much more complex situation exists for the nmax=8 clusters whose evolution at the particular temperature kT/J=0.22 is illustrated in Fig. 5. At early times, say up to t0, the cluster distribution is almost identical to the nmax=4 case, since the fraction of larger clusters is negligible. However the larger clusters then grow, initially with the diffusion aggregation distribution whose details are hardly seen in the figure. The distribution then changes as the more compact clusters containing squares of atoms grow at the expense of the clusters with shorter lifetimes. The 4-atom square, and the two 5-atom square plus single bond clusters are the first to appear distinctly from the close distribution of the 34 clusters of up to 5 atoms. At later times the folded double square appears and grows rapidly at one time. However the larger 8 atom clusters take an ever larger fraction of the distribution and from the these several clusters with planar faces emerge with significant probabilities. A complex redistribution is seen to take place as these clusters take an ever larger fraction of the total. A balance occurs between the growth probabilities and the decay rate. Of the 611 clusters of up to 8 atoms differentiated in this computation, the cube is unique in that all its atoms are triply coordinated, so that its decay rate is the lowest with the value exp(-3J/kT). Its a priori probability is very low - at zero temperature the cube's fractional occupation is 1.37x10⁻⁶, Its fractional occupation builts up only slowly by aggregation, and it is only at the longest times that the cube begins to dominate the distribution.
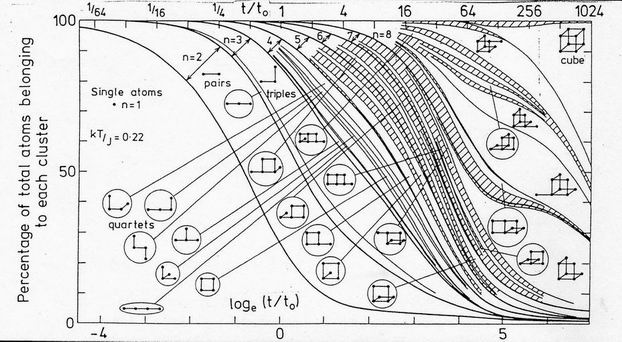
FIG. 5. Aggregation of 8-atom clusters at J/kT=0.22. As in Fig. 4, the distribution of the 611 distinct clusters is shown as a function of time on a logarithmic scale. Individual clusters are shown and labelled only if their occupation fraction exceeds 0.02 at some time. Shaded areas represent cluster occupations too closely spaced to be distinguished. Heavy lines distinguish clusters containing different numbers of atoms. Only in the cube are all the atoms triply bonded. Despte its low intrinsic growth probability, it eventually becomes the dominant cluster.
Having evaluated and stored the cluster fractions, it is straightforward to calculate other distributions. In the lower part of Fig. 6 is shown the coordination number distribution which substantiates the above picture. Around loget/t0=0 when condensation of single atoms into clusters is virtually complete, the majority of atoms have single or double coordination characteristic of the "stringy" aggragation clusters. However over the next two decades of time the clusters grow by "Ostwald ripening" -smaller clusters generally have several atoms of low coordination and readily "evaporate", while larger clusters with higher coordination remain. The mean coordination number increases. In the last two decades shown the cluster size distribution does not greatly change. They rather "compact" as the open clusters with singly and doubly coordinated atoms decay more rapidly than the more compact clusters. 4-fold and higher coordinated atoms form some 6% of the total at one time, but in this case with a limit of 8-atom clusters, they fail to maintain themselves. The extrapolation to the case of unlimited cluster size, can be imagined. At temperatures J/kT below 0.2 and times below say t/t0, the proportion of clusters with n>8 would be neglible and the present calculations would be accurate. At larger times, the compact clusters would again be favoured, whatever their size and a large number of cube-containing clusters would emerge, just as in the present case the square-containing clusters are seen.
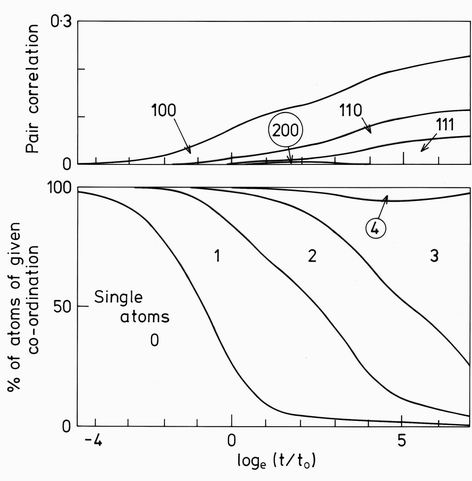
FIG. 6. The coordination number distribution (lower curves) and pair correlations (upper curves) for the cluster aggregation shown in fig. 5. The growth of triply bonded atoms at the expense of other coordinations is clear. Only the first 4 pair correlations are shown, but all others have negligible magnitude.
The relationship to the small angle neutron scattering can be made through the pair correlations shown in the upper part of Fig. 6. The correlations beyond r=(111) are seen to be rapidly attenuated. Their Fourier transform shown in Fig. 7 has the expected form in the log/log representation shown. At low scattering vectors Q, the curves follow a Guinier law: S(Q) = exp(-Rg2Q2/3), where Rg is the radius of gyration of the cluster. At larger Q values the curve becomes linear for a limited region before it curves up into an oscillatory function not shown. The slopes in this linear region were plotted as the smooth line in Fig. 1. They are seen to follow the experimentally measured values with remarkable accuracy.
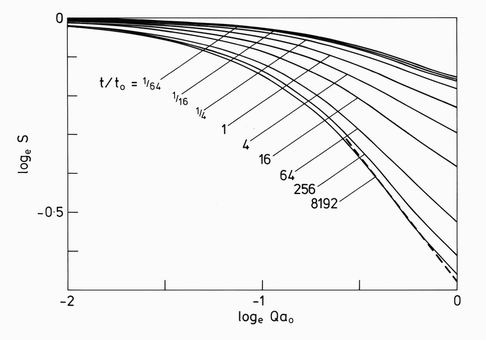
FIG. 7. The scattering function obtained from fourier transformation of the pair correlations shown in Fig. 6. The results are given on a log/log representation for the selection of times marked. The exponents shown in Fig. 1 are derived from the maximum slopes of these curves, as illustrated by the dashed line.
Results have also been obtained for clusters on a face centred cubic lattice with both first and second nearest neighbour interactions. The clusters are much more numerous and results were only obtained for the 74 clusters of up to four-atoms. The computations were performed for an attractive second neighbour interaction and a repulsive near neighbour interaction. It lead to the L12 ordered phase as seen experimentally in the aluminium alloy shown in Fig. 1.
In conclusion, the early stages of aggregation at low temperatures are shown to follow a detailed path in which particular clusters are favoured at each stage. The growth and decay of each cluster can be described through its probability of formation and its decay modes.
1 I. M. Lifshitz and V. V. Slyozov, J. Phys. Chem Solids 19, 35 (1961).
2 J. W. Cahn and J. E. Milliard, J. Chem. Phys, 28, 258 (1958).
3 J. S. Langer, M. Bar-on and H. D. Miller, Phys Rev. All, 1417 (1975).
4 J. Marro, J. L. Lebowitz and M. H. Kalos, Phys. Rev. Letters 43, 282 (1979).
5 R Becker and W. Doring, Ann. Phys. (Leipzig) 24, 719 (1935)
6 G. Kostortz, "Neutron Scattering", Vol 15 of "Treatise on Materials Science and Technology, p227,Academic Press (1979).
7 C. G Windsor, R. N Sinclair, V. S. Rainey, B. Normand and A W Bowen, J Phys F. Met Phys. 17, L229 (1987).
8 M. Furasaka, Y. Ishikawa and M. Mera Phys. Rev. Letters 54, 2611 (1985).
9 H P Peters, D Stauffer, H P Holters and K. Loewenich, Z. Physik B 34, 399, (1979).
10 M. Eden, "Proceedings of the Fourth Berkeley Symposium on Mathematical Statistics and Probability. J. Neyman (ed), Vol. IV, p223. Berkeley and Los Angeles, University of California Press (1961).
11 O. Penrose and A. Buhagiar, J. of Statistical Physics, 10, 219 (1983).
12 K. Binder and D. Stauffer Phys. Rev. Letters 33, 1006 (1974).
13 P Meakin, Phys. Rev. 27A,1495 (1983).