
J. Phys. F: Met. Phys. 17 (1987) L229-L235. Printed in the UK
Changing dimensionality in the early growth of clusters in an evaporated Al-Cr-Fe alloy
C G Windsor1, R N Sinclair1, V S Rainey1, B Normand1,2 and A W Bowen3
1Materials Physics and Metallurgy Division, Harwell Laboratory, Oxon OX11 ORA, UK
2Present address: Churchill College, Cambridge, UK
3Materials and Structures Dept., Royal Aircraft Establishment,
Farnborough, Hants, GUI4 6TD, UK
Received 1 July 1987
Alloys grown by vacuum evaporation offer a unique opportunity to study the early stages of precipitation. Prepared at relatively low temperatures, they avoid the effects of quenching from an equilibrium high-temperature phase. They overcome the solubility restrictions imposed by the phase diagram, permitting high volume fractions of low-mobility solute atoms. For example the chromium concentration in quenched aluminium alloys is limited to less than 0.3 wt% (Rivlin and Raynor 1980), but this can be extended to 16 wt% by vacuum evaporation (Bickerdike et al 1965, 1986a, b). A more commercially useful alloy is Al-7 wt% Cr-1.2 wt% Fe, which has been prepared by co-deposition from an electron-beam-heated melt onto an aluminium substrate held at 260 C. The high volume fraction and low diffusion rates of chromium and iron in aluminium give an alloy which, after ageing, has the remarkable tensile strength of 800 MPa, good corrosion resistance, and a high degree of thermal stability (Bickerdike et al 1986c).
Small-angle neutron scattering permits the size and shape of precipitate clusters to be followed during ageing (Kostorz 1979). Several recent experiments (Katano and lizumi 1984, Furusaka et al 1985) and Monte Carlo computations (Sur et al 1977, Binder 1977, Lebowitz et al 1983) have noted the scaling of the cluster structure factor, and the time evolution of cluster size, assuming the roughly spherical clusters predicted by the theory of Lifshitz and Slyozov (1985) (Marder 1985). Cluster shape can be revealed from the slope of the Porod plot of the logarithm of the macroscopic cross section dS/dW; as a function of the logarithm of the scattering vector Q. A slope of -1 at high Q values is characteristic of linear clusters, a slope of -2 of planar clusters and a slope of -4 of nearly spherical clusters (Kortorz 1979). This Letter reports scattering experiments showing a progression in Porod plot slopes from -1.1 to -3.6 which is interpreted as an evolution in cluster shape during low-temperature segregation. Taken alone, this interpretation is not unique. Scattering data over a finite Q range can equally well be explained in terms of a size distribution of spherical clusters. Our interpretation is justified by examples of cluster growth from a Monte Carlo model whose Fourier transform gives a scattering pattern with Porod law slopes showing the same trend.

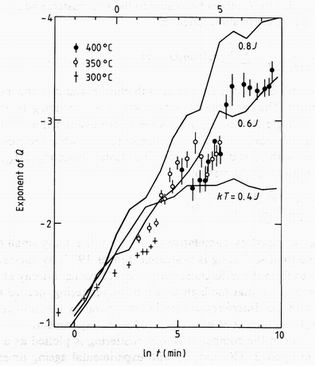
Three time-dependent experiments were performed with the samples mounted in situ within a furnace held at 300, 350 and 400 C respectively. The small-angle neutron scattering instrument of the PLUTO reactor was operating at 6 A wavelength to give a useful Q range from 0.01 to 0.17 A-1 (Page 1978). The sample thickness of 10 mm gave a transmission of 0.93 with negligible multiple scattering. Empty furnace and calibration runs, using a 1 mm thick light water sample, enabled the sample macroscopic cross section to be expressed in cm-1 sr-1 units. The furnace could be raised to temperature in less than 5 min. Runs were recorded at intervals of 10 to 120 min, according to the rate of change of the scattering, over periods of 24 h at each temperature. The points and error bars in figure 1 show Porod plots of the data at selected times. The three sets of symbols correspond to the three temperatures, and it is seen that the later runs at lower temperatures superimpose well on early runs at higher temperatures. This correspondence defines a logarithmic shift in the time scale at each temperature. An Arrhenius plot of this shift against the inverse absolute temperature suggests a single activation energy of 1.9 +/- 0.1 eV. This effect has been seen before (Komura et al 1983). We use it to combine the cross sections measured at the three temperatures to give a segregation sequence whose effective time range at 350 C ageing temperature covers four decades from 0.5 minutes to 10 days.
A key feature of figure 1 is the changing slope of the Porod plot. The points in figure 2 show this evaluated for each scattering distribution recorded, and plotted against the logarithm of the effective ageing time at 350 C. In each case the maximum slope is chosen. Near 2 h at 350 C the slope at low Q values stabilises near the value -2.5, but at the same time the Porod plot becomes curved and a steeper slope appears at high Q.
This sequence of slopes can be reproduced by Monte Carlo computations on an idealised model of the real alloy. A binary alloy AfB1-f is assumed, with a concentration f=0.1 of A atoms distributed over a 16x16x16 simple cubic lattice with periodic boundary conditions. Nearest neighbour Ising interactions J between A atoms only were assumed, 1/2J being the energy of a single A-A bond. The method of Metropolis et al (1953) was used to study the approach to equilibrium. The method follows previous calculations. However, its one parameter kT/J, where kT is the thermal energy, has been set to lower values than have been generally considered. Segregation into two phases first occurs at kT/J= 4.51. For values 2 < kT/J< 4 conventional Ostwald ripening with roughly spherical clusters occurs, and will not be discussed here. The present computations were for kT/J=0.02, 0.2, 0.4, 0.6, 0.8, 1 and 2. Using assembler coding on the 68008 microprocessor of a Sinclair QL, a two-day 'run' completed around 2000 trial exchanges per site (t0), sufficient for complete aggregation at the higher temperatures, to defines the time unit of the computation and may be related approximately to the diffusion constant of the A atoms in the alloy. The arrays were stored at a factor of two intervals from 1/8th to 2048 t0, and indexed by labelling each A atom connected by nearest neighbour bonds to other A atoms as a distinct cluster (Sur et al 1977).
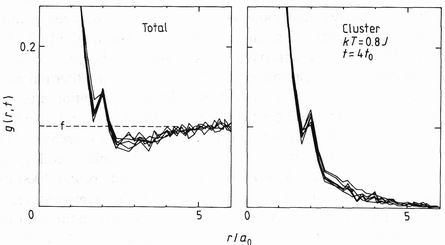
Figure 3.The computed pair correlations as a function of neighbour distance r at the fixed time t = 4t0, including all A sites (total), and including only those connected by A-A bonds (cluster). The six curves represent six independent starting configurations.
The neutron scattering cross section can be calculated from the model through the pair correlation function g(r, t) as a function of neighbour distance r and ageing time t. If nk(ri) is set to 1 for sites r, occupied by A atoms belonging to the kth cluster, and zero otherwise, it is possible to define a cluster correlation function
gc(r,t)=[1/z(r][1/SNk] Sk SiNk nk(ri)nk(ri+r)
involving nk, the number of occupied A sites in the kth cluster, and z(r) the multiplicity of the neighbours at distance r. The conventional total correlation function gt(r, t)is given by including all A sites as a single cluster. Figure 3 shows both evaluated as a function of r. The total function extrapolates at large r to the concentration f, while the cluster function approaches zero, together with its statistical error. The cluster scattering Sc(Q, t) can then be evaluated from the Fourier transformation
Sc(Q, t) = Sr=0infinity [sin(Qr)/Qr]gc(r,t)z(r)
without the result being swamped by cumulative errors from the many small correlations at large r. In contrast the total scattering is evaluated (Binder 1977) by subtraction of the A atom mean density n to form the differences (nri - nbar). These may decay at large r, but their statistical error remains, so that the high Q tail of the scattering, needed to define its exponent, is easily lost in noise. Interference correlations, given by the difference between the two functions, are lost, but then none were observed in the experiment.
The maximum exponent in the computed cluster scattering is plotted as a function of time as the full curves in figure 2. The good fit with experimental ageing times at 350 C defines the computation step time as t0=7 +/- 1 min, and the temperature scale as kT= 0.6J+/- 0.2J at 350 C. The broken and full curves in figure 1 show the computed scattering at kT=0.6J and 0.8J respectively. The overall Q and intensity scales were adjusted to fit experiment, but are constant over the figure. Generally the fit is good considering the serious shortcomings of the model: the Al-Cr-Fe alloy is face-centred, not simple cubic; the precipitate observed by x-ray and electron diffraction after ageing is not a chromium rich cluster, but a mixture of the fine precipitate seen by Bickerdike et al (1986a, b) and the monoclinic Q phase CrAl7 observed by Cooper (1960).
The changing morphology of the clusters during ageing was studied by identifying each cluster through its centre of gravity in the lattice, and tracing its growth, often from a chance fluctuation in the initial configuration, throughout the ageing sequence. By using the same pseudo-random starting configuration, the evolution of a particular cluster at different temperatures could be studied. Some example are shown in the inset in figure 4. Three regimes of temperature can be defined.
(i) kT << J. At low temperatures the diffusing atoms aggregate into the string-like clusters aptly described as 'knots' by Merica (1932). At these temperatures an excitation breaking any bond is improbable, but atomic rearrangements leading to configurations of equal or lower energy remain possible. These allow the formation of links between the early clusters so forming the chains giving a -1 exponent.
(ii) kT < J. At thermal energies appreciably less than that corresponding to an A-A bond, the single-bonded atoms at the ends of chains become strongly preferred sites for excitation. Condensation is most likely to occur onto at least double-bonded cluster sites. This process leads to plate-like structures which would give the -2 exponent seen in the early stages of aggregation in this and also in the experiment of Furusaka et al (1985).
(iii) kT <~ J. At intermediate thermal energies, double-bonded atoms on the corners of plates become the most likely sites for thermal excitation. These may diffuse away, but are most likely to find a site in the same cluster with at least triple-bonding. This is the coordination number of atoms at the corners of a cube and so is characteristic of three-dimensional structures giving the -4 exponent. The observation of the collapse of these diffuse clusters into a more spherical shape during ageing has been noted previously in both the experiment of Blaschko et al (1982) and in the simulations of Sur et al(1977).
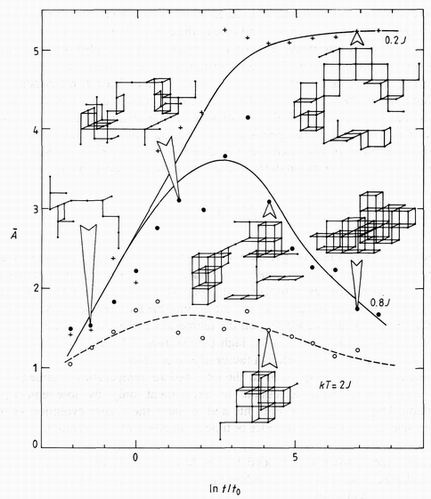
A quantitative description of these changes in shape is given by an asphericity factor
depending on the radius of gyration rgk of the kth cluster, and weighted according to cluster size nk. This function approaches unity for a sphere. Figure 4 shows A evaluated for three temperatures as a function of time. At a low temperature, kT=Q.2J, A rises rapidly to form stable diffuse clusters. At an intermediate temperature, kT=O.SJ, A rises as before, but at a time depending on the temperature, the clusters compact themselves to form nearly spherical clusters. At a high temperature, kT= 2J, clusters must be compact to be stable, and A remains within a factor of two of unity.
Thus our alloy corresponded to the intermediate temperature regime (kT<~ J), whose early stages were made accessible to experiment only by low-temperature vapour deposition. Our simple model both fits and explains the cluster evolution as measured by neutron scattering over four decades of time at an effective temperature.
The experimental work was funded by the Ministry of Defence (UK). The calculations were undertaken as part of the underlying research programme of the United Kingdom Atomic Energy Authority.
References
Bickerdike R L, Clark D, Eastabrook J N, Hughes G, Mair W N, Partridge P G and Ranson H C 1985 Int. J.
Rapid Solidification 1 305
1986a Int. J. Rapid Solidification 2 1
1986b Int. Conf. Rapidly Solidified Alloys p 137
Bickerdike R L, Clark D, Hughes G, McConnell M C, Mair W N, Partridge P G and Viney B W 1986c Int.
Conf. Rapidly Solidified Alloys p 145
Binder K 1977 Phys. Rev. B 15 4425
Blaschko O, Ernst G, Fratzl P, Bernole M and Auger P 1982 Acta. Metall. 30 547
Cooper M J 1960 Acta. Crystallogr. 13 257
Furusaka M, Ishikawa Y, Yamaguchi S and Fujino Y 1985 Phys. Rev. Lett. 54 2611
Haasen P, Gerold V,Wagner R and Ashby M F (ed.) 1984 Decomposition of Alloys: the Early Stages
(Oxford: Pergamon)
Katano S and lizumi M 1984 Phys. Rev. Lett. 52 835
Komura S, Osamura K, Fujii H and Takeda T 1983 Physica 120B 397
Kostorz G 1979 Neutron Scattering vol. 15 Treatise on Materials Science and Technology (New York:
Academic) p 227
Lebowitz J L, Marro J and Kalos M H 1983 Comment. Solid State Phys. 10 201
Lifshitz I M and Slyozov V V 1961 J. Phys. Chem. Solids 19 1935
Marder M 1985 Phys. Rev. Lett. 55 2953
Merica P D 1932 Trans. AIME 99 13
Metropolis N, Rosenbluth A W, Rosenbluth M N, Teller A H and Teller E 1953 /. Chem. Phys. 21 1087
Page D I 1978 AERE Report R 9878
Rivlin V G and Raynor G V 1980 Int. Metals Reviews no 4
Sur A, Lebowitz J L, Marro J and Kalos M H 1977 Phys. Rev. B 15 3014