C G Windsor1, J M Marshall2,6, J G Morgan3 J Fair2,7, G D W Smith1,4, A. Rajczyk-Wryk2,8 and J M Tarrago5
1Tokamak Energy, 120A, Olympic Avenue, Milton Park, OX14 4SA, UK
2Sandvik Hyperion, Torrington Avenue, Coventry CV4 0XG, UK
3Culham Electromagnetics, D5, Culham Science Centre, Abingdon, OX14 3DB
4Department of Materials, University of Oxford, 16 Parks Road, Oxford OX13PH, UK
5Sandvik Hyperion, Pol. Ind. Roca, C/ Verneda s/n, 08107 Martorelles, Barcelona, Spain
6Present address: Materials and Analytical Sciences, Department of Physics, University of Warwick, Coventry, CV4 7AL, UK
7Present address: 30 Halifax Road, Shirley, Solihull, B90 2BS, UK
8Present address: Mayerton Refractories Ltd. 7 Hockley Court, 2401 Stratford Road,
Hockley Heath, B94 6NW, UK
E-mail: colin.windsor@tokamakenergy.co.uk
Abstract
Results are reported on cemented tungsten carbide (cWC) and boride-containing composite materials for the task of shielding the centre column of a superconducting tokamak power plant. The shield is based on five concentric annular shells consisting of cWC and water layers of which the innermost cWC shield can be replaced with boride composites. Sample materials have been fabricated changing the parameters of porosity P, binder alloy fraction fbinder and boron weight fraction fboron. For the fabricated materials, and other hypothetical samples with chosen parameters, Monte Carlo studies are made of: (i) the power deposition into the superconducting core, (ii) the fast neutron and gamma fluxes and (iii) the attenuation coefficients through the shield for the deposited power and neutron and gamma fluxes. It is shown that conventional Co-based cWC binder alloy can be replaced with a Fe-Cr alloy (92 wt.% Fe, 8 wt.% Cr), which has lower activation than cobalt with minor changes in shield performance. Boride-based composite materials have been prepared and shown to give a significant reduction in power deposition and flux, when placed close to the superconducting core. A typical shield of cemented tungsten carbide with 10 wt.% of Fe-8Cr binder and 0.1% porosity has a power reduction half-length of 0.06 m. It is shown that the power deposition increases by 4.3% for every 1% additional porosity, and 1.7% for every 1 wt.% additional binder. Power deposition decreased by 26% for an initial 1 wt.% boron addition, but further increases in fboronr showed only a marginal decrease. The dependences of power deposited in the core, the maximum neutron and gamma fluxes on the core surface, and the half attenuation distances through the shield have been fitted to within a fractional percentage error by analytic functions of the porosity, metallic binder alloy and boron weight fractions.
Keywords: spherical tokamaks, fusion reactors, materials synthesis
1. Introduction
Fusion energy provides one of the world's few options for safe, carbon-free energy, baseload power production [1]. While the world awaits results from ITER [2], the technological innovations of high temperature superconductors (HTS) and spherical tokamaks offer an opportunity to make a much smaller power plant, providing that the engineering obstacles can be overcome [3]. One such obstacle is the design of a suitable shield to reduce the neutron and gamma ray heating in the superconducting core, and to limit radiation damage. The high energy of the 14 MeV neutrons created in the fusion process makes them highly penetrating and they need to be slowed to lower energies before significant absorption occurs.
Tokamak Energy has made progress in addressing this problem [4-6] using the MCNP Monte Carlo code [7]. Shields based on alternating layers of tungsten carbide and water were used. The water layers slow the neutrons down and the heavy atoms present in tungsten carbide help absorb the gammas and further attenuate the neutrons through the (n,g) reaction. This paper only considers water cooling for the shield, as used in the ITER project. Water has several disadvantages including short-lived gamma activation through the 16O+ n=16N+p reaction which produces ~6 MeV gammas with a 7 second half life. Any power plant must consider "blanket" shields containing lithium which can lead to tritium breeding through the 6Li+n=4He+3H reaction. An example is the molten salt FLiBe which will be considered in future work. Being without hydrogen, its higher average atomic weight makes it a less efficient neutron moderator leading to thicker shields.
A specific challenge is the lack of space available in the case of spherical tokamaks. Their low aspect ratio A=R0/a, where R0 is the plasma major radius and a is the minor radius of the plasma, gives them the important advantage of allowing more efficient utilisation of the magnetic field and permitting a higher plasma pressure. On the other hand, the allowable radius of the centre column, containing the superconducting core, vacuum space and shield, is limited to Rcol=R0.(1 - 1/A), and decreases as the aspect ratio decreases, limiting the space available for a shield given that required for the superconducting core.
Two problems arise because of the limited space for shielding. High temperature superconductors need to run at temperatures of order 20 K to allow operation at magnetic fields up to 20 T. As well as the thermal heat conduction into the core, the power deposition into the core from neutron and gamma heating must be removed in the steady state by cryo-cooling. A second problem is that the neutron and gamma fluxes inevitably cause radiation damage, which could cause degradation of the superconducting properties. The neutron and gamma fluxes at the surface of the superconducting core are thus important variables to be minimised.
An optimal shield needs to perform several functions at the same time. Some atoms such as boron have high cross sections for neutron absorption, but only at low energies. "Moderating" materials slow the neutrons by elastic collisions. Light atoms such as the hydrogen within water enable a neutron to lose much of its energy in this way. Atoms of high atomic number, such as tungsten, have high (n,g) cross sections. However, the high-energy gammas created cause their own heating and damage to the core and must be absorbed in the shield as far as possible. Gammas are absorbed or scattered to lower energies by the electrons in high atomic number materials, so again tungsten is a good gamma attenuator. It is important that any candidate materials do not activate enough to form harmful quantities of radioactive isotopes.
This paper considers the option of cemented tungsten carbide and mixed tungsten and boride-containing materials as shields for a spherical tokamak fusion pilot plant, although the results are equally valid for other applications. Recent experimental work has shown that materials containing tungsten, iron and boron can be processed using the same powder metallurgy processes as for cemented tungsten carbide alloys (cWCs). This work reports the first set of physical data and models incorporating data taken from the initial set of selected W-B-Fe(Cr) materials, where the precise atomic compositions have been included in the neutronics computations.
2. Cemented tungsten carbide as a shield material
Tool steels have long used cemented tungsten carbide tips. Cemented WC alloys combine the hardness of the WC phase with a ductile metallic binder alloy, enabling a wide range of geometries and applications via powder metallurgy. Properties are determined by WC grain size and binder weight fraction, defined as fbinder. In general, during cWC processing, the binder alloy does react with the WC to a limited extent [8-13] in terms of C and W alloying with the binder during liquid phase sintering [10-12] but does not form inter-metallic ternary phases (such as M6C) during optimal processing conditions. In contrast, the boride-based materials discussed in detail in section 6 form as a result of reactive sintering with the Fe-8 wt.% Cr binder alloy (hereafter termed "Fe-8Cr") and do not possess a metallic binder after sintering. However, the same definition of fbinder is used for the Fe-8Cr alloy in boride materials for simplicity even though for the boride materials it is a reagent rather than a metallic binder. When considering boride materials Cr and Fe are treated as a single unit, since Cr and Fe are sufficiently similar in terms of atomic mass and reactivity in this context.
A summary of the composition, magnetic properties and basic thermal properties of selected cWC materials is shown in table 1 [8-10]. Saturation magnetism Msat for Cobalt cWCs was calculated using values from a model Co-W-C alloy [10] which best replicated the composition of the cobalt binder alloys resulting from liquid phase sintering. Values of Msat from Fe-8Cr cWCs were measured directly as shown in [8], alongside thermal expansion a (10-6 K-1) and thermal conductivity k
(W m-1 K-1). For Fe-8Cr cWC a notation has been adopted where the letter describes the target WC grain size and the number the weight fraction fbinder in wt%. For example, A10 has ultra-fine WC (target diameter (d50) 0.4 µm) with fbinder = 0.1 and E12 has ultra-coarse WC (d50 8 µm) with fbinder = 0.12. Letters B, C and D are intermediate WC grain size in ascending order. Samples with two letters (e.g. AE10) are a mixture of different WC grain sizes with a 1:1 mass ratio of ultra-fine (A) and ultra-coarse (E). Relative to Co, Fe-8Cr as a binder significantly hinders WC grain growth during liquid phase sintering so the actual d50 (WC) is significantly less than the target d50. Figure 1 compares the microstructures of WC-Fe-8Cr materials A10 and D10.
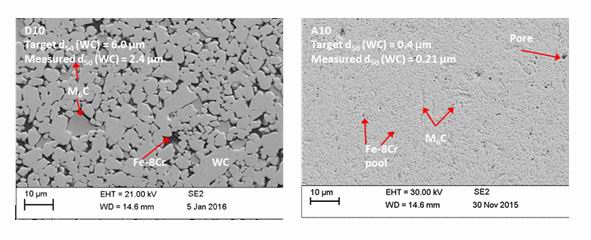
Figure 1.
Microstructures of WC-Fe-8Cr cWC as sintered. (a) shows D10 a coarse-grained cWC with some M6C presence. Fe-8Cr binder pools and ligaments are visible. (b) shows a fine-grained Fe-8Cr cWC A10. M6C presence is more abundant than for D10 and is present as linear features. The fine grain size makes the WC skeleton and Fe-8Cr binder harder to distinguish. Note that sintered WC grain size is significantly less than target WC grain size.
Table 1.
The grain size d50, binder weight fraction fbinder, sintered density rsintered, critical magnetic field hc, saturation magnetisation Msat, magnetic and thermal properties of cemented carbides with cobalt and with the Fe-8Cr binder materials A10 and D10.
| cWC | d50 | fbinder | rsintered | hc | Msat | a x10-6 K-1 | | k Wm-1K-1 | | Ref |
| Type | µm | Wt fraction | kg m-3 | kA m-1 | 10-7 Tm3kg-1 | a298K | a873K
| k298K | k873K | |
.
| WC-Co1 | 0.4 | 0.062 | 14730 | 40.09 | 93.5 | 5.8 | 5.4 | 54.5 | 57.6 | [9], [10] |
| WC-Co2 | 0.8 | 0.10 | 14460 | 20.06 | 140.1 | 6.8 | 6.8 | 99.0 | 76.3 | [9], [10] |
| WC-Co3 | 1 | 0.06 | 14910 | 20.15 | 92.1 | 6.4 | 6.3 | 90.5 | 73.1 | [9], [10] |
| WC-Co4 | 6 | 0.10 | 14520 | 6.18 | 164.5 | 6.9 | 6.1 | 106.9 | 66.0 | [9], [10] |
| A10 | 0.21 | 0.10 | 14210 | 29.60 | 105.9 | 6.3 | 7.0 | 48 | 46.0 | [8] |
| D10 | 2.4 | 0.10 | 13550 | 3.34 | 167.5 | 6.0 | 6.6 | 108 | 62.9 | [8] |
Table 2.
The Young's moduli E, the transverse rupture test TRS, compressive strength, hardness HV30, and plane strain K1c of standard cemented carbides with cobalt and with the Fe-8Cr binder. The Young's moduli of the A10 and D10 samples have been estimated from the law of mixtures.
| cWC | E | 3 point TRS (MPa) | | Compressive Strength (MPa) | | HV30 | K1c | Source |
| Type | GPa | mean | Std% | mean | Std% | kgf mm-2 | MPa m0.5 | Refs. |
| WC-Co1 | 621 | 4049 | 14.8 | 8560 | 3.3 | 2067 | 8.1 | [9] |
| WC-Co2 | 583 | 4647 | 5.5 | 6471 | 2.7 | 1595 | 11 | [9] |
| WC-Co3 | 631 | 3687 | 5.9 | 6206 | 3.2 | 1618 | 10.2 | [9] |
| WC-Co4 | 585 | 3160 | 2.9 | 4107 | 1.0 | 1053 | 19.8 | [9] |
| A10 | 580* | - | - | - | - | 1821 | 7.4 | [8] |
| D10 | 580* | - | - | - | - | 1056 | 9.2 | [8] |
*Calculated from the law of mixtures
Generally, cWCs have a ferromagnetic metallic binder and are therefore ferromagnetic, as are the boride materials in this work. Msat is proportional to the free metallic binder content but is dependent on binder composition and weight fraction. For Co-cWC, Msat decreases with dissolved tungsten content [10, 11] in the two-phase field, hence its use in non-destructive evaluation of sintered parts [8-13]. No such two-phase field exist for Fe-8Cr cWCs but Msat has been shown to be highly dependent on carbon content and the presence of ternary phases, particularly M6C which are present in a W-rich binder alloy [8]. For Fe-8Cr materials, Msat has a minimum value when M6C and other ternary phases are least present.
Table 2 shows the transverse rupture strength (TRS), ultimate compressive strength, Vickers Hardness (30 kg equivalent) and K1c plane strain fracture toughness (Shetty) for the selected materials. It is seen that cWCs in general have high modulus and yield stress combined with good toughness over a wide temperature range. Conventionally, the binder material is cobalt metal, but cobalt is not suitable for nuclear applications because of its high activation. Alternative binder materials to Co metal are currently under evaluation [8] and Fe-8Cr has been shown to be a suitable alternative to cobalt, in that it has similar corrosion and oxidization resistance to cobalt and can be processed using conventional powder metallurgical processes. Alongside performance, there is a strong safety case for use of cWCs as shielding rather than W metal-based shields because of higher resistance to oxidation in the worst-case scenario of sudden exposure of hot reactor surfaces to oxygen [14, 15].
Much of the data presented here is for the alloy A10 which contains 10 wt.% binder and has a porosity of around 0.1%. Previous research [8] showed that due to the fine-grained nature of A10, the majority of the binder phase was consumed to form the carbon deficient brittle intermetallic phase M6C (M = Fe(Cr), W). A porosity of 0.1% is somewhat high for a cWC material. This is a reflection on the fact that Fe-8Cr is a very recent binder composition for such materials [8]. The neutron mean free path in the A10 shield material is of order 18 mm. This distance is large compared with the characteristic distances of microstructure, grain size and composition fluctuations in the shield, which are likely to be sub-millimetre. The largest microstructural defects seen so far have been of order 10 microns. The only relevant inputs for the MCNP computations are the overall density and atomic compositions, as measured from actual samples.
Grain size has a significant impact on thermal properties [8, 9]. D10, a coarse-grained material with the same binder content as A10, is included in the data for this reason. From Table 1, thermal conductivity is significantly greater for D10 even when the higher porosity is taken into account. D10 is closer to a realistic engineering material than A10 when thermo-mechanical properties are considered [8]. However, the high porosity of D10 led to the selection of A10 as a reference first generation Fe-8Cr cWC.
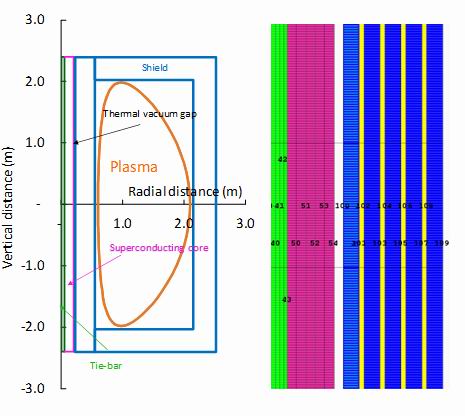
Figure 2.
The layout of the assumed plasma and centre column. On the left a 1.35 m major radius plasma (orange) is shown within a surrounding cylindrical shield 0.32 m thick (green). On the right the centre column construction is shown. The inner tie-bar (green) of radius 0.05 m is surrounded by the HTS superconducting core of thickness 0.15 m (violet). A 0.03 m thick vacuum gap separates the 20K temperature core from the 0.32 m thick cylindrical shield which contains 4 concentric water-cooling channels each 0.015 m thick. The cylindrical shell of the shield nearest the core is coloured lighter and is where the boride-containing material is best inserted [5]. The small numbers in the core section represent the "tally" surfaces used in the MNCP computations. The diagram is only schematic. A realistic shield might be composed of many interlocking components, when streaming of neutrons through any gaps in the structure would need to be minimised.
3. The deposited power and fluxes though the reference cemented tungsten carbide shield A10
Tokamak Energy has been using the Monte Carlo code MCNP [4] to determine the energy deposited in the centre high-temperature superconducting column of a spherical tokamak pilot plant. Results are presented here for the design by Costley, Hugill and Buxton [16] of a possible fusion power plant with major radius R0=1.35 m, aspect ratio A=1.8 and fusion power Pfus=175 MW. Such a plant would produce a neutron power Pneut=(4/5)Pfus=140 MW, and since each fusion neutron has an energy 14.1 MeV, or 2.259x10⁻¹² J, the number of neutrons produced is nneut=140/2.259x10-12 = 6.2x10¹⁹ s-1. This figure is important as the MCNP results express the power deposition and fluxes as per source particle, so need to be multiplied by this number.
The MCNP simulation launches 14.1 MeV neutrons uniformly and isotropically within a toroidal volume at 1.35 m major radius of elliptical cross section 0.286 m high and 0.125 m wide approximating to the volume where the majority of the neutrons are created by D-T fusion. The path of each neutron created is followed as it interacts with the materials defined in the design, according to the Fendl library of cross sections, creating a cascade of daughter particles, including gammas, alpha particles and protons. These are in turn are followed until they are absorbed, leave the outer boundary of the design, or for photons go below the MCNP photon cut-off energy of 0.001 MeV, when the they are readily absorbed.
Power deposition is calculated by creating tally volumes within specified surfaces as shown by the feint lines on the right of figure 2. Tally type 6+ used here includes power deposition by both neutrons and gammas, as both contributions are important. Fluxes are determined for both neutrons and gammas separately for each defined tally surface.
The full red line in figure 3 shows the power deposition into the mid-plane section of the centre column of the reference design including the A10 cemented tungsten carbide shield material, water layers, the HTS core, and the inner Eurofer 97 tie-bar. It is almost identical to the dashed blue line of the cobalt binder material. The HTS core and its coolant has been homogenised giving a mean density of 6980 kgm-3.
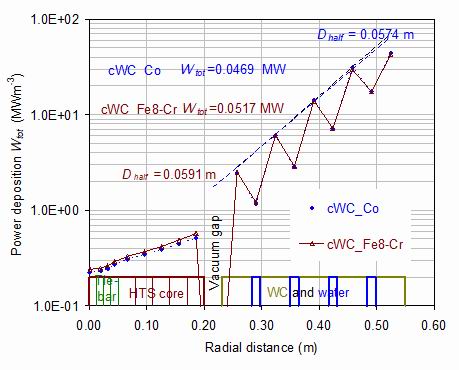
Figure 3.
The power deposition per unit volume through the centre-column of the plant, as a function of radius for the vertical mid-plane section. The red line with open triangles refers to the reference material A10 with 10 wt.% of Fe-8Cr alloy binder. The blue closed symbols and dashed lines refer to cWC with 10 wt.% of pure cobalt binder. The total power into the HTS core Wtot is the integral of this power up to 0.2 m radius and over all vertical sections. The long-dashed lines show a fit to the upper bound of the four inner cWC sections which define the half attenuation distances Dhalf.
Figure 3 illustrates that the power deposition into the narrow (15 mm thick) water layers is considerable, indeed larger than in the wider (52 mm thick) tungsten layers if measured per unit mass. The concentric layers of shield produce an exponential decrease in power, which can be defined by the distance Dhalf which halves the power. The power deposition into the HTS core decays only slightly with distance. The key output variable is the total power into the 20K temperature core including all vertical segments, of 0.0507 MW for the Fe-8Cr A10 manufactured sample and 0.0469 MW for the pure cobalt binder hypothetical sample. The power deposited in the core is some 10% greater for Fe-8Cr compared with Co, but 4.4% of this is accounted for by the zero-porosity assumed for the cobalt alloy.
The attenuation distance though the shield is also superior for the cobalt binder, with the half attenuation distance less by 14.5 %. However, these minor differences are far outweighed in the case of a pilot plant neutron shield by the much higher activation of cobalt compared with the Fe-8Cr alloy. Cobalt has a 1-year activation over 20 times that of either iron or chromium.
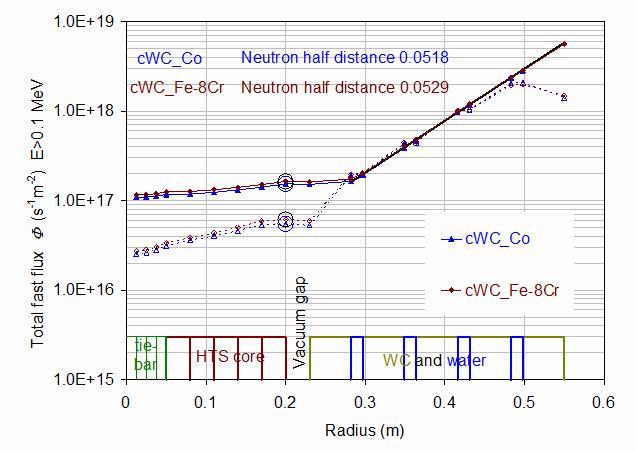
Figure 4.
The energy integrated fast (E0.1 MeV) neutron and gamma fluxes f as a function of radius from the core, at the mid-plane height. Neutrons are full lines and closed symbols, gammas are dashed lines and open symbols. The red lines with diamonds refer to the reference material A10 with 10 wt.% of Fe-8Cr alloy binder. The blue triangles refer to cWC with 10 wt.% of pure cobalt binder. The large circles show the key parameters of the neutron and gamma fluxes at the mid-plane section of the superconducting core. The heavy full and dashed lines define the attenuation through the shield for A10. The slopes of these two lines are other key parameters in the analysis of samples in this paper.
Of equal importance are the neutron and gamma fluxes entering the HTS core, which determine the radiation damage. The highest core irradiation will occur at the mid-plane surface of the core as shown by the large open circles in figure 4. The lines in the figure show the attenuation of the neutron and gamma fluxes through the shield. Because low energy neutrons and gammas are less damaging, the figure shows the fast fluxes, defined as those with energies E > 0.1MeV. The lines show the almost exponential decrease of both fluxes through the shield, although with a slightly faster attenuation for neutrons than for gammas. The fluxes then stay nearly constant through the superconducting core.
The average fluxes and energies discussed in this paper are a summary description of the situation. The MCNP computations provide the energy distributions at some 61 energies spaced roughly logarithmically between 10-8 MeV and 20 MeV. The differential fluxes at the outer surface of the HTS core for A10 will be discussed later in connection with shields incorporating boride materials in section 6.
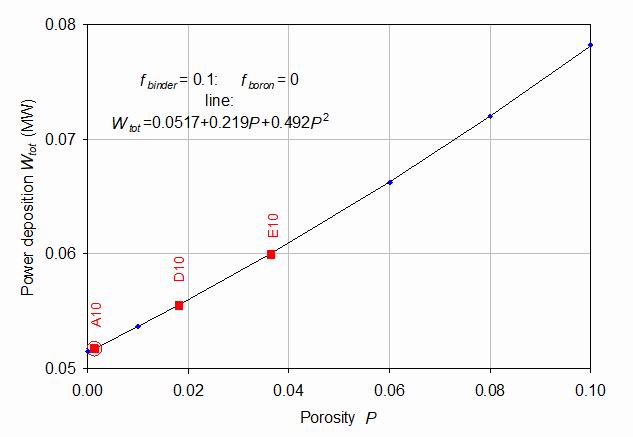
Figure 5.
The power deposition Wtot into the superconducting core and tie-rod as a function of porosity P. The red squares represent the deposition calculated using MCNP for fabricated named samples and measured composition and porosity, the blue diamonds represent MCNP results for hypothetical samples of defined porosity. The open circle denotes the reference sample A10.
4. Porosity dependence of the shield for 0.1 binder fraction
A series of cWC samples were produced at Sandvik Hyperion with a constant 10 wt.% content (0.1 weight fraction) of the Fe-8Cr binder alloy with no boron, but with varying levels of porosity. MCNP calculations were performed with these alloys and with five hypothetical alloys with a range of porosities chosen to reveal the variation of the computed properties with porosity level. Some hypothetical alloys may be impossible to manufacture. Porosity for the cWC materials can be defined via visual inspection as part of quality control evaluation (ISO 4499-3:2016) but this is less straightforward in boride composites. For these materials, porosity is defined both by visual inspection and comparison of measured densities with those calculated for boride-containing materials with zero remaining carbon.
Figure 5 shows the variation of the power deposition into the superconducting core as a function of the porosity. This shows that a low value is highly desirable. The points show a nearly linear increasing energy deposition with increasing porosity, as may be expected from the reduction of the tungsten carbide content. However, there is a significant positive quadratic variation with porosity. The full line shows the total power deposition:
Wtot=v1[1+v2*(P - P0)+v3*(P - P0)2]
with v1 = 0.0517 MW, v2=4.24 and v3=9.51. P0 is the porosity of the reference sample A10.
Figure 6 shows the fast (E > 0.1 MeV) neutron and gamma fluxes plotted against porosity. Neutron fluxes are generally around 2.6 times larger than the gamma fluxes, although the mean gamma energy can be considerably higher than the mean neutron energy. Both fluxes follow a similar pattern against porosity as the power deposition with a generally linear dependence with a significant quadratic term. They are fitted by the same function of form:
F(P) = v1[1 + v2*(P - P0) + v3*(P - P0)2].
The parameters vi are constrained to fit to the fluxes for the reference A10 sample. For neutrons: v1=1.64x10¹⁷ s-1m-2, v2=3.85 and v3=7.43, and for gammas: v1=0.614x10¹⁷ s-1m-2, v2=3.59 and v3=16.8.
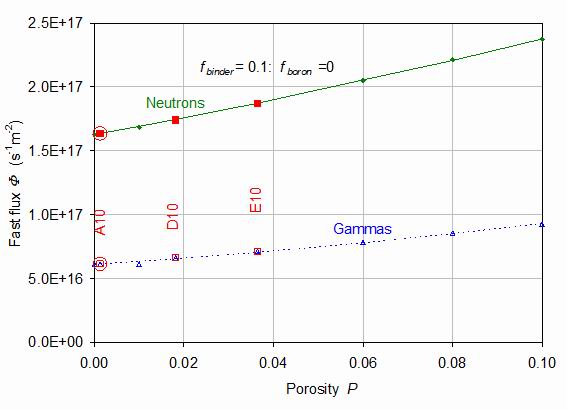
Figure 6.
The fast (E>0.1 MeV) fluxes of neutrons (closed symbols and full line) and gammas (open symbols and dashed line) as a function of porosity P. The red squares represent fabricated samples while the green diamonds and blue triangles are hypothetical samples. The lines are constrained to pass through the reference sample A10 indicated by large circles and represent the fitted functional form.
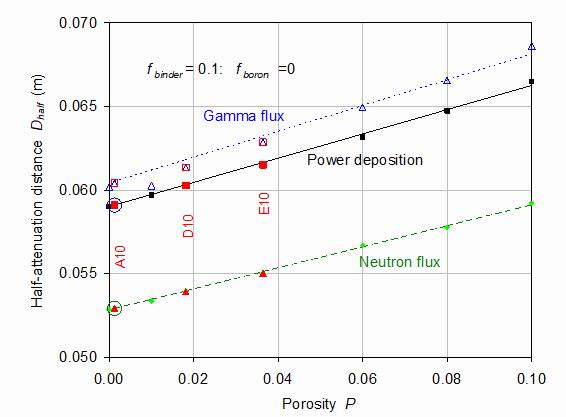
Figure 7.
The half-attenuation distances Dhalf through the shield for power deposition (closed squares), fast neutron flux (closed triangles) and gamma fluxes (open triangles) as a function of porosity P. The red symbols represent fabricated samples while the small blue, green and black symbols are hypothetical samples. The reference material A10 is indicated by the large circles.
Figure 7 shows these attenuation coefficients through the shield evaluated as described in the discussions of figures 4 and 5. The power attenuation includes both neutrons and gammas, whereas in the flux attenuation these are distinguished. The attenuations are seen to have close to a linear variation with porosity. Each result has been fitted by the same function Thalf = v1[1 + v2*(P - P0)] and is constrained to pass through the reference sample A10 with porosity P0, indicated by the large circles. The intercepts A are appreciably different, with the values v1=0.0591 m, v2=1.23 for power, v1=0.0529 m, v2=1.19 for neutrons and v1=0.0604 m, v2=1.28 for gammas.
The neutrons are generally attenuated more rapidly than the gammas as they pass through the shield. However, porosity causes only a proportional change. The slope constants v2 in the above fits are similar for power, neutrons and gammas.
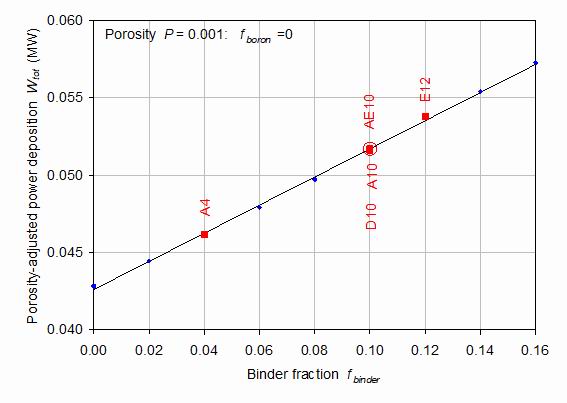
Figure 8.
The adjusted power deposited into the superconducting centre core as a function of the fraction of Fe-8Cr binder in the cemented carbide shield. Boron-containing samples are not included. The red labelled squares correspond to fabricated samples and their measured properties. The blue diamonds are hypothetical samples. All points refer to the power deposition adjusted using the analytic fit in figure 5 to correspond to the constant porosity of 0.001 of the reference A10 sample.
5. Binder fraction dependence of the shield for 0.001 porosity
Sandvik Hyperion also produced several samples of varying binder content between 4 and 12 %. Once again MCNP calculations were performed both for these samples and for a series of hypothetical samples with binder factions from 0 to 14% to help understand the underlying dependence of the shield properties with binder fraction. The fabricated sample key results are tabulated in table 5.
Figure 8 shows the power deposited into the centre superconducting core of the pilot plant as a function of fbinder, the fraction of Fe-8Cr binder in the cemented tungsten carbide shield adjusted to correspond to the 0.001 porosity of the reference sample A10. Corrections for the differences of porosity between the fabricated porosity and this value have been made using the equation corresponding to the line in figure 5. This reference sample is indicated by the large red circle in the figure.
Clearly, a low binder content is highly desirable from the point of view of minimising the power deposition. As with figure 5 for porosity, there is a close to linear dependence on the fraction of binder, although in this case there is little suggestion of any quadratic or other deviation from the linear dependence. The variation with binder fraction is appreciable, with a 33% increase in power deposition across the plot. However, this is a smaller variation than that associated with porosity. Both fabricated and hypothetical samples are used in making the least squares fit to the function:
Wtot = v1[1 + v2*(fbinder - f0)] where f0 =0.1 is the binder fraction of the A10 reference sample. v1 = 0.0517 MeV and the slope v2 = 1.76. The fit is good even though the three samples for fbinder= 0.1 have quite different porosities.
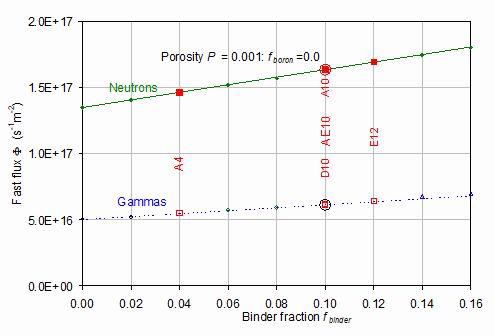
Figure 9.
The fluxes at the outer surface of the superconducting centre core as a function of the fraction of Fe-8Cr binder in the cemented carbide shield. The red labelled squares correspond to fabricated samples and their measured properties. The other smaller diamonds are hypothetical samples. All points refer to the porosity dependence calculated using the curves of figure 6 to correspond to a constant porosity of 0.001. The lines are analytic functions fitted to the data, constrained to pass through the circled reference sample A10.
Figure 9 shows the associated variations of the neutron and gamma fluxes as a function of binder fraction. This time, the two fabricated samples D10 and E12, with porosity corrections, have significant (~2%) deviations from the linear plots for both neutrons and gammas. As with figure 8 for the porosity dependence, there is a close to linear dependence for both neutrons and gamma particles. The least squares fit to the function: F = v1[1 + v2*(fbinder - f0)] gave for neutrons the intercept v1 = 1.64*1019 s-1m-2 and the slope v2 = 1.75. For gammas, the intercept was v1 = 0.614*1019 s-1m-2 and the slope v2 = 1.83. The neutron flux is again some 2.5 times higher than the gamma flux. The proportional increase with binder fraction is similar for neutrons and gammas. Unlike figure 6 for the corresponding fluxes against porosity, there is no distinct curvature to the distributions.
The half-distance attenuation distances through the shield as a function of binder fraction are shown in figure 10 for power deposition, neutron flux and gamma flux. It is seen that the best attenuation (shortest half distance) is always achieved with low binder fraction. Again, each of the samples has been adjusted to correspond to the porosity 0.001 using the linear equations illustrated in figure 7. In this case the three samples with varying porosities at 0.1 binder fraction fit well onto the line. All three lines are nearly parallel and show little signs of any curvature.
All the example points are fitted by linear plots of the form: Dhalf = v1[1+ v2*(fbinder - f0)] where f0=0.1 is the binder fraction of the A10 reference. The values v1 are appreciably different, with the values 0.0591, 0.0529 and 0.0606 m, for power, neutrons and gammas respectively. The power value falls between the neutron and gamma half-distances. The slopes v2 are quite similar to each other with the values 0.556, 0.553 and 0.648 m.
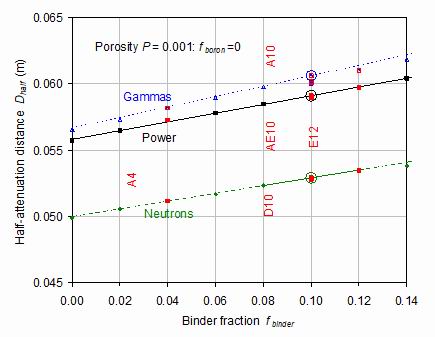
Figure 10.
The distances Dhalf through the shield corresponding to a factor two attenuation in deposited power, neutron flux and gamma flux as a function of the fraction of Fe-8Cr binder in the cemented carbide shield. The red labelled squares correspond to fabricated samples and their measured properties. The black, green and blue symbols represent hypothetical samples for power, neutron and gamma attenuations. All points refer to attenuations calculated using the curves of figure 8 to correspond to the constant porosity of 0.001 corresponding to the reference A10 sample, shown circled.
6. Dependence on boride fraction in the shield
It was shown in [5] that the inclusion of boron in the shield material was useful, especially close to the inner superconducting core. 10B has a large neutron absorption cross section which increases with decreasing energy. Sandvik Hyperion has produced several samples of boride materials. This section describes the shielding properties of such samples. In all cases only the inner of the five cylindrical shield sections in the MCNP model have been replaced as in figure 2. Other sections are composed of cWC A10.
There are several complications to be addressed in the discussion of boride compounds, since these are not liquid-phase sintered materials. The boride materials form from reactive sintering between the three precursor reagents; B4C (average composition); Fe-8Cr and W metal powder. Table 3 shows the weigh-in proportions of reagents used for each composition based on a 100g mill charge, initial carbon content from reagents (wt%) based on B4C content and the theoretical density rtheo estimated from reagents since no accurate x-ray data yet exist for these materials.
Table 3.
Compositions of boride-containing samples and theoretical densities rtheo calculated from the weighted average density of reagents.
| Composition | Reagent weigh in wt% | | | rtheo | Carbon (reagents) |
| | B4C | Fe-8Cr | W metal | kg m-3 | wt% |
| B3 | 3 | 20 | 77 | 12939 | 0.65 |
| B5.5 | 5.5 | 22 | 72.5 | 11436 | 1.20 |
| B7 | 7 | 23 | 70 | 10709 | 1.52 |
| B9 | 9 | 25 | 66 | 9822 | 1.96 |
Composition B5.5 was calculated to produce samples where the Fe-8Cr alloy content would be &aprox; (Fe at% + Cr at%) &aprox; 33 at% to approximate the ternary alloy W:B:(Fe+Cr) = 1:1:1 atomic proportions as a baseline, excluding carbon. Other compositions were generated by varying the W and B content with (Fe at% + Cr at%) kept constant.
Boride-containing compounds used in this study were produced using laboratory scale conventional powder metal processing methods used for cWC hard metals as for [8] and discussed in detail by [12]. Powder charges were milled using cWC-based media with a media:charge ratio of 9:1 for three hours in ethanol with an organic binder as a pressing aid. Samples were sintered at 14500C in vacuum and by sinterHIP (50 bar Ar). No significant differences were observed between vacuum sintered and sinterHIPped materials. Shrinkage and mass loss were within values observed from standard cWC materials; the majority of mass loss was attributable to the organic pressing aid used as for conventional cWC.
Table 4.
Sintered properties of boride-containing materials and net carbon loss
| Composition | Shrinkage | Mass loss | r* | r*/rtheo | hc | Msat | K1c | C (Sintered) |
| | % | % | kg m-3 | % | kA m-1 | x10-7 T m3 kg-1 | MPa m0.5 | wt% |
| B3 | 20.62 | 3.30 | 13200 | 102.17 | 5.39 | 103.76 | 5 | 0.60 |
| B5.5 | 22.03 | 2.98 | 12620 | 108.98 | 1.13 | 142.2 | 8.4 | 0.76 |
| B7 | 18.27 | 3.30 | 10810 | 99.11 | 3.1 | 75.71 | 6.3 | 1.03 |
| B9 | 19.46 | 3.02 | 10940 | 103.36 | 6.51 | 69.3 | 6.4 | 1.42 |
Sintered samples were subjected to quality control tests to measure density, magnetism and mechanical properties. For carbon determination (CONS test), samples were pulverised and heated to 30000C via induction heating to measure sintered carbon content via gas chromatography. All boride-containing samples showed a significant loss of carbon with the difference being the greatest for compositions B9 and B5.5 with net losses of 0.54 wt% and 0.46 wt% respectively, equivalent to between a third to a half of the starting elemental carbon prior to sintering. Physical and magnetic properties of boride-containing materials are shown in table 4. The table shows that some properties, such as the saturation magnetisation Msat, depend systematically on boron content, others such as the plane strain K1c, show no such systematic dependence. The shield neutronics performance is likely to be determined only by the measured compositions, and by the density, which could change during lifetime use through irradiation damage.
From table 4 the sintered density appears anomalously high, but this is most probably due to rtheo being calculated from the density of the reagents, not from lattice parameters. Owing to the preliminary nature of the materials used in this work, no quantitative crystallographic data exist for these materials to date. Most of the sample showed poor quality or incoherent electron diffraction patterns. Hence, the exact composition of the iron boride and mixed boride phases is as yet unknown. Figure 11 shows microstructures for (a) B5.5 and (b) B9. The microstructure of the boride-containing materials differs significantly from cWCs in that there is no well-defined hard phase skeleton or binder phase. Initial microstructural evaluation indicates that W, Fe(Cr) and B, along with the carbon present in the boron carbide react to form a wide range of phases. Qualitative analysis of sintered materials using Electron Back-Scatter Diffraction (EBSD) using methods based on previous studies on cWCs [13] indicated that iron borides, M6C and iron tungsten borides were most prevalent with significant quantities of WC, WB2 and WB present as precipitates.
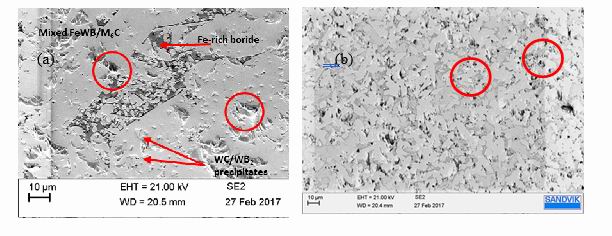
Figure 11.
Scanning Electron Microscopy images of materials used in calculations. Paler contrast is observed in more Z-rich regions relative to darker contrast. Red circles surround porous regions in (a) and (b). (a) Shows the microstructure of B5.5 - a composition where atomic Fe(Cr): W:B are near 1:1:1. FeBx and FexWyBz are evident as well as WB2/WC precipitates. (b) is the more boron rich B9 composition (at% ratios 30:20:40%) - more porosity and less Fe-rich regions are evident.
Figure 11 shows that there is no defined hard phase or binder phase seen in figure 11(a) or figure 11(b) and the microstructure itself differs significantly between the two boride-containing microstructures shown. For composition B5.5, large areas of mixed FexWyBz and M6C coexist with more well-defined FeBx regions, shown by the darker elemental contrast for FeBx relative to W-rich areas. Both regions have W-rich precipitates, some of which have been identified as WB2 and WC with WB and FeB coexisting within the Fe-rich regions. Some porosity is apparent, along with pull-out and features indicative of fracture on cross-sectional polishing. For composition B9, there are no large phase regions; this sample appears to be composed of interlinked W-rich boride-containing crystals with mixed FexWyBx phases in between. More porosity was observed for this composition relative to B5.5, particularly in the interstitial spaces. The preliminary nature of these materials is evident in the complex microstructure and significant unidentified phases present.
The microstructural images also show that defining porosity in the boride-containing materials is somewhat problematic, in that it is difficult to define theoretical density without knowledge of the phase abundance and lattice parameters, which require future quantitative evaluation. For the boride-containing compounds the porosity and binder fraction are both appreciably larger than those for the reference A10. It follows that corrections need to be made to all the computed parameters, adjusting to some reference porosity and binder fraction before the effects of the boron can be isolated.
Figure 12 shows the mid-plane neutron and gamma fluxes for an innermost shield composed of B5.5 compared with the reference A10 material. The actual effects of the boron addition are most clearly seen in the energy spectrum of the neutron and gamma flux. The neutron fluxes for the two samples are increasingly divergent below 0.1 MeV as the boron preferentially absorbs the lower energy neutrons. The power depositions into the superconducting core for inner shields made from the four boride-containing samples, and the control material A10 are shown in figure 13. In this and succeeding figures, the red curve with squares is the uncorrected value, the blue triangles the values adjusted to correspond to a constant porosity of 0.001 for both the boride-containing and cWC inner shield layer, and the green diamonds are the values adjusted additionally to a binder fraction of 0.1.
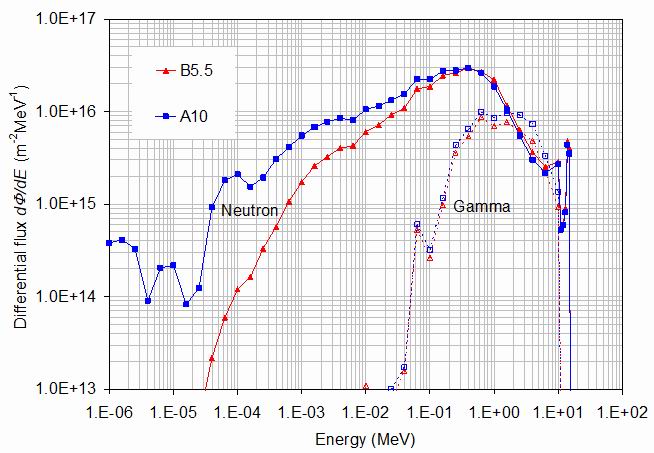
Figure 12.
The energy spectra of neutrons (full lines and filled symbols) and gammas (dashed lines
and open symbols) for the boride-containing sample B5.5 (red triangles) compared with the reference cWC A10 (blue squares). The gamma spectra are similar (the differences are probably due to the different porosities and binder fractions). However, the neutron spectra below 0.1 MeV are quite different with the boride-containing sample neutron flux falling fast below 10-4 MeV.
It is seen that the unadjusted power deposition is reduced by a significant 22% by the addition of an inner layer of just 2.35% boron. However, further boron content gives little improvement. Similarly, boron additions in the outer layer did not significantly affect performance [5]. In contrast, the power depositions at constant porosity and binder fraction show a continuous improvement with the power deposition roughly halved at 7 wt.% boron content. The full line in figure 13 shows a fit by the function Wtot=v1*exp(-ln(2)*fboronrv3/v2) where fboronr is the boride weight fraction, and the constants are v1=0.0517 MW, v2=0.404 and v3 = 0.383.
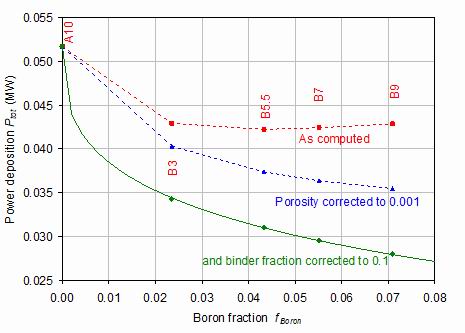
Figure 13.
The power deposition into the superconducting centre core for the four boride-containing samples and for the cWC reference material A10. The red squares are the raw values, the blue triangles are adjusted to a porosity 0.001, and the green diamonds are adjusted to give both porosity 0.001 and binder fraction 0.1. The bold line is the fitted function given in the text.
The corresponding neutron and gamma fast fluxes at the surface of the superconducting core are shown in figure 14. The notation is unchanged except that gamma fluxes are with open symbols and dashed lines. It is seen that neither the neutron nor the gamma fluxes are significantly changed by the boron additions. Possibly, this is because the boron additions only attenuate the flux at energies largely below the 0.1 MeV cut-off for the fast fluxes.
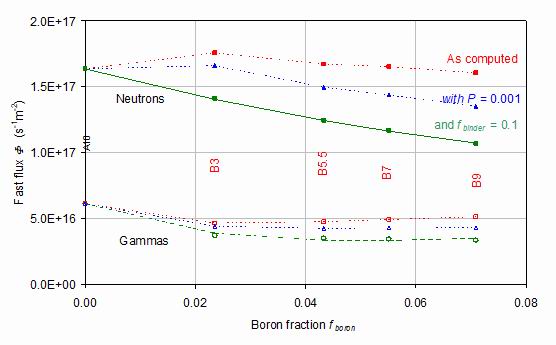
Figure 14.
The neutron and gamma fluxes at the surface of the superconducting centre core for the four boride-containing samples and for the cWC reference material A10. Filled symbols and continuous lines are for neutrons and open symbols and dashed lines for gammas. The red squares are the raw values, the blue triangles are adjusted to a porosity 0.001, and the green diamonds are adjusted to a binder fraction equal to 0.1 of the total sample mass.
Figure 15 shows the shield effectiveness through the three distances by which the power, neutron flux and gamma flux is halved. Again, the effects of porosity and binder fraction are seen to be important. Although the shield performance improves with boron content at constant porosity and binder fraction, the raw compounds show a more modest improvement. It must be noted that the real materials used in this work represent the first iteration of Fe-8Cr cWCs and boride based materials. Further work will generate materials that have significantly improved microstructure and porosity.
Table 5.
The properties for the fabricated samples of varying porosity P, binder fraction fbinderf and boron weight fraction fboronr. The key properties are the total power deposited into the cryogenic tie-bar and shield Wtot, the neutron and gamma fluxes Fneutron and Fgamma at the mid-plane outer surface of the core, the thickness of the shield corresponding to half attenuation of the power, Dhalf for neutrons, DhalfNeutron and for gammas DhalfGamma. Borides are present in the last four samples in table 5 and are placed in the innermost layer, as illustrated in figure 2. A larger table including results from the hypothetical samples and including mean energy results is given in the supplementary data.
| Sample | Porosity | fbinder | fboron | Wtot | Fneutron | Fgamma | DhalfPower | DhalfNeutron | DhalfGamma |
| | | (weight) | (weight) | MW | s-1m-2 | s-1m-2 | m | m | m |
| A10 | 0.0013 | 0.100 | 0.000 | 0.0517 | 1.64E+17 | 6.14E+16 | 0.0591 | 0.0529 | 0.0606 |
| cWC_Co | 0.0000 | 0.100 | 0.000 | 0.0469 | 1.54E+17 | 5.49E+16 | 0.0574 | 0.0518 | 0.0584 |
| AE10 | 0.3640 | 0.100 | 0.000 | 0.0599 | 1.87E+17 | 7.12E+16 | 0.0615 | 0.0550 | 0.0629 |
| D10 | 0.0181 | 0.100 | 0.000 | 0.0555 | 1.74E+17 | 6.60E+16 | 0.0603 | 0.0539 | 0.0613 |
| A4 | 0.0510 | 0.040 | 0.000 | 0.0570 | 1.77E+17 | 6.73E+16 | 0.0608 | 0.0542 | 0.0619 |
| E12 | 0.0120 | 0.120 | 0.000 | 0.0563 | 1.77E+17 | 6.68E+16 | 0.0605 | 0.0541 | 0.0618 |
| B3 | 0.0160 | 0.200 | 0.024 | 0.0429 | 1.76E+17 | 4.66E+16 | 0.0583 | 0.0534 | 0.0567 |
| B5.5 | 0.0301 | 0.216 | 0.043 | 0.0422 | 1.65E+17 | 4.94E+16 | 0.0586 | 0.0528 | 0.0562 |
| B7 | 0.0377 | 0.231 | 0.055 | 0.0424 | 1.65E+17 | 4.94E+16 | 0.0589 | 0.0528 | 0.0562 |
| B9 | 0.0460 | 0.252 | 0.071 | 0.0429 | 1.61E+17 | 5.14E+16 | 0.0591 | 0.0525 | 0.0562 |
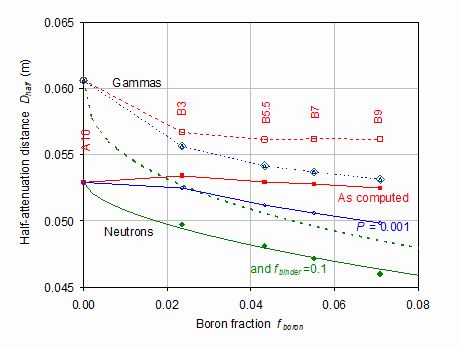
Figure 15.
The neutron and gamma half-intensity distance though the shield for the four boride-containing samples and for cWC reference A10. The notation is the same as for figure 14. The heavy lines show the fit to the porosity and binder fraction adjusted data.
7. Summary equations and conclusions
The key results from the previous sections are tabulated in table 5 for the physical samples made. Results from the hypothetical samples are given in the supplementary data. The first line of table 5 tabulates the key parameters describing the effectiveness of the A10 "reference" sample for shield usage. The relationships derived in the last three sections may be combined to yield summary equations giving the key shield performance parameters defined in the table in terms of the three input variables of porosity, binder fraction and boron weight fraction. The parameters are defined as deviations from those of the reference sample. The success of the parameterisation can be assessed using a "scatter plot" in which the actual values of the parameters for each material sample are plotted against the calculated values.
Figure 16(a) shows such a plot for the power deposited in the cryogenic superconducting core. The ordinate is calculated from the equation
Wtot = v1[1+v2(P - P0) + v3(P - P0)2+v4(fbinder - fb0)]*exp(-ln(2)*fboronv5/v6) (1)
where the parameters are v1=0.0517 MW, v2=4.24, v3= 9.51, v4= 2.17, v5=0.412 and v6=0.376. v1 is the deposited power for the reference sample A10 at porosity
P0=0.00137, binder fraction fb0 = 0.1 and no boron fboron=0. The fit is seen to be good to an RMS error of 0.47%.
Figure 16(b) shows the analogous plot for the neutron and gamma fluxes at the mid-plane outer surface of the superconducting core. The ordinate is here calculated from the equation
F = v1[1+v2(P - P0) + v3(P - P0)2+v4(fbinder - fb0)]*(1 - v5*fboron+v6*fboron2) (2)
where for neutrons the parameters are v1=1.65*1017 s-1m-2, v2=3.85, v3= 7.43, v4= 1.91, v5 =6.50 and v6 =25.11. For gammas the parameters are v1=0.614*1017 s-1m-2, v2=3.59, v3= 16.8, v4= - 1.90, v5 =6.57 and v6 =79.1. The fit to the neutron fluxes has a root mean square error of 0.32% and that for gammas to 0.40%.
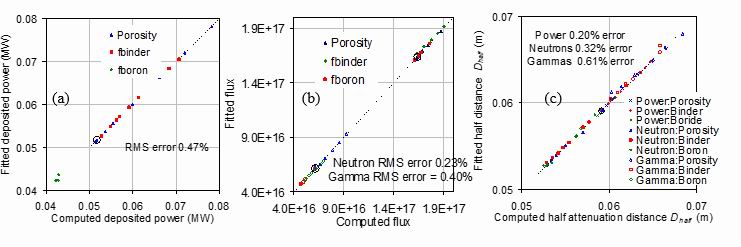
Figure 16.
The power deposition (a), and neutron and gamma fluxes (b) into the superconducting core and half attenuation distances within the shield for power, neutrons and gammas (c) fitted using equations 1, 2 and 3 compared with the values computed using MCNP. Blue triangles denote the porosity series, green diamonds the binder series and red squares the binder samples. The reference material A10 is circled.
These good fits mean that good estimates of these key variables of core power deposition and neutron and gamma surface fluxes may be reliably estimated for cWC with Fe-8Cr binder materials from their porosity and binder and boron weight fractions. Lastly, the shield performance is considered in terms of the distance Dhalff required to half the transmitted power, neutron flux or gamma flux. A simplification of equation 2 can be used to define the halving distance in each case in terms of the three key parameters of porosity, binder fraction and boron weight fraction.
Dhalf = v1[1+v2(P - P0)+v4(fbinder -
fb0)]*exp(-ln(2)*fboronrv5/v6) (3)
For transmitted power the parameters are v1=0.0590 m, v2=0.0726, v4= 0.0344, v5=1.523 and v6=0.459. For neutron flux the parameters are v1=0.0529 m, v2=0.0629, v4= 0.0293, v5=1.07 and v6=0.603. For gamma flux the parameters are v1=0.0606 m, v2=0.0745,
v3= 0.0388, v5=1.07 and v6=0.407. The accuracy of these fits is shown in figure 16(c). Once again, the points corresponding to varying porosity, binder fraction and boron weight fraction are distinguished. The three cases of power, neutron flux and gamma flux are indicated by line symbols, closed symbols and open symbols respectively.
The good fits illustrated in the scatter plots of figure 16 to the analysis given by equations 1 to 3 suggest that this paper provides a sound basis for estimating the shielding behaviour of a wide range of cemented carbide and boride materials in terms of the key parameters of porosity, binder fraction and boron weight fraction. The best shields have low porosity, low binder fraction and high boron content. Cemented tungsten carbide and boride-containing materials are capable of giving favourable values for the key neutronic properties of a tokamak shield: low heat deposition, and low fluxes of both neutrons and gammas, and good attenuation through the shield. The exceptional performance of cemented tungsten carbide and boride-containing material is summarised in the relatively short shield distances required to halve the transmitted power and neutron and gamma fluxes. The actual materials prepared have been from the first-generation cemented Fe-8Cr cWCs and W-B-Fe(Cr) borides. Therefore, the net reduction in radiation load from cWC/boride-containing shields shown in this work is a conservative estimate - later iterations are likely to be better performers with respect to porosity and density.
References
[1] Sykes A., Costley A. E., Windsor C. G., Asunta O., Brittles G., Buxton P., Chuyanov V., Connor J. W., Gryaznevich M. P., Huang B, Hugill J., Kukushkin A., Kingham D., Langtry A. V., McNamara S., Morgan J. G., Noonan P., Ross J. S. H., Shevchenko V., Slade R, and Smith G. 2018 Compact Fusion Energy based on the Spherical Tokamak Nuclear Fusion 58 016039 https://doi.org/10.1088/1741-4326/aa8c8d
[2] ITER official website: https://www.iter.org/
[3] Menard J. E. et al 2016 Fusion nuclear science facilities and pilot plants
based on the spherical tokamak Nucl. Fusion 56 106023 https://doi.org/10.1088/0029-5515/56/10/106023
[4] Windsor C. G., Morgan J. G. and Buxton P. F. 2015 Heat deposition into the superconducting central column of a spherical tokamak fusion plant Nuclear Fusion 55 023014 http://iopscience.iop.org/article/10.1088/0029-5515/55/2/023014
[5] Windsor C. G., Morgan J. G., Buxton P. F., Costley A. E, Smith G. D. W. and Sykes A. 2016 Modelling the power deposition into a spherical tokamak fusion power plant Nuclear Fusion 57 036001 http://iopscience.iop.org/article/10.1088/1741-4326/57/3/036001
[6] Windsor C. G. and Morgan J. G. 2017 Neutron and gamma flux distributions and their implications for radiation damage in the shielded superconducting core of a fusion power plant Nuclear Fusion 57 116032 http://iopscience.iop.org/article/10.1088/1741-4326/aa7e3e
[7] Goorley T. et al 2012 Initial MCNP6 release overview
Nucl. Technol. 180 298-315 https://doi.org/10.13182/NT11-135
[8] Humphry-Baker S. A., Marshall J.M., Smith G. D. W. and Lee W. E. 2017 Thermophysical properties of Co-free WC-FeCr hardmetals, 19th Plansee Seminar, At Plansee, Austria. International Journal of Refractory Metals and Hard Materials https://www.researchgate.net/publication/318708043_Thermophysical_properties_of_Co-free_WC-FeCr_hardmetals
[9] Sandvik website 2008: Your perfect partner: Cemented Carbide http://www.allaboutcementedcarbide.com Copyright: Sandvik AB
[10] Roebuck B., Almond E. A. and Cottenden A. M. 1984 The influence of composition, phase transformation and varying the relative F.C.C. and H.C.P. phase contents on the properties of dilute Co-W-C alloys Materials Science and Engineering 66 179-194 https://www.sciencedirect.com/science/article/pii/0025541684901794
[11] Marshall J. M. and Kusoffsky A. 2013 Binder phase structure in fine and coarse WC-Co hard metals with Cr and V carbide additions International Journal of Refractory Metals and Hard Materials 40 27-35
https://www.sciencedirect.com/science/article/pii/S0263436813000760
[12] Marshall J. M. and Giraudel M. 2015 The role of tungsten in the Co binder: Effects on WC grain size and hcp-fcc Co in the binder phase International Journal of Refractory Metals and Hard Materials 49 57-66 http://www.sciencedirect.com/science/article/pii/S0263436814002479
[13] Mingard K. P., Roebuck B., Marshall J. M. and Sweetman G. 2011 Some aspects of the structure of cobalt and nickel binder phases in hardmetals Acta Materialia 59 2277-2290 http://www.sciencedirect.com/science/article/pii/S1359645410008256
[14] Humphry-Baker S.A. and Lee W. E. 2016 Tungsten carbide is more oxygen resistant than tungsten when processed to full density Scripta Materialia 116 67-70
https://www.sciencedirect.com/science/article/pii/S1359646216300112
[15] Humphry-B 4aker S. A., Ke Peng and Lee W. E. 2017 Oxidization resistant tungsten carbide hardmetals International Journal of Refractory Metals and Hard Materials 66 135-143 http://www.sciencedirect.com/science/article/pii/S0263436816306199
[16] Costley A. E., Hugill J. and Buxton P. F. 2015 On the Power and Size of Tokamak Fusion Pilot Plants and Reactors Nuclear Fusion 55 033001 http://iopscience.iop.org/article/10.1088/0029-5515/55/3/033001/
