Dipartimento Elettronica e Telecomunicazioni, Universita degli Studi di Firenze, Via S. Marta 3, 50139 Firenze, Italy, Capineri@ieee.org,

 Insight, 54, 331-337, 2012,: Accepted 17/05/12. DOI: 10.1784/insi.2012.54.6.331
Buried Object classification using holographic radar
C Windsor, L Capineri and T D Bechtel
Colin Windsor BA, DPhil, FRS is a retired consultant with Culham Centre for Fusion Energy, OX14 3DB, UK. He read physics at Oxford University
and then conducted doctorial work (DPhil) measuring magnetic materials, and had a postdoctoral year at Yale University. He returned to Harwell
in its golden years to study itinerant metals. He later used neural networks in a variety of industrial applications.
116, New Road, East Hagbourne, OX11 9LD, UK. colin.windsor@virgin.net

Professor Lorenzo Capineri was born in Florence, Italy, in 1962. In 2004, he became an Associate Professor of Electronics with the Department
of Electronics and Telecommunications, University of Florence, Florence, Italy. His current research activities are in the design of ultrasonic
guided wave devices and pyroelectric sensor array, signal processing for pipes and landmine detection with ground-penetrating radar.
Dipartimento Elettronica e Telecomunicazioni, Universita degli Studi di Firenze,
Via S. Marta 3, 50139 Firenze, Italy, Capineri@ieee.org,

Professor Timothy D Bechtel BSc, MSc, PhD took a BSc in Geology in 1982 at Haverford College, PA, USA. At Brown University, RI, USA,
he took an MSc in Engineering Geology in 1984 and a PhD in Geophysics in 1989. He is currently Principal Geophysicist at Enviroscan Inc,
Lancaster, PA, USA, and is also in the faculty of Earth and Environment, Franklin and Marshall College, Lancaster, PA, USA.
timothy.bechtel@fabdm.edu,

The ability of RASCAN holographic radar to distinguish buried objects through their shape and texture has been investigated. RASCAN produces data that can be processed into a two-dimensional subsurface image suitable for object identification either by eye or by computer, where scanned receptive fields can be used for object location and trained neural networks for object identification. With the eventual objective of distinguishing buried antipersonnel landmines from battlefield clutter, the five objects considered were: a simulated mine, a small unexploded shell, a crushed aluminium can, a short length of barbed wire and a stone. In the first experiments, the objects were buried in fine, dry sand so that the object classification methods could be tested in the absence of the inevitable false alarm features arising from rough and uneven surfaces and soil inhomogeneity. Training data were collected from 11 scans, each containing these five objects at random positions and depths. The simulated mines were identified with 100% success, with zero false alarms in both training and testing. The clutter test objects were identified with around a 75% success rate and about 15% false alarms. An unseen validation image correctly identified the mine and three of the four clutter objects.
Keywords: Ground penetrating radar, GPR, holographic radar, demining, clutter, neural networks
Submitted 10.02.12
Accepted 17.05.12
DOI: 10.1784/insi.2012.54.6.331
1. Introduction Holographic radar works by comparing the phase of a sinusoidal field reflected from a buried object and from a ground surface reflection with the
internal reference phase of the transmitting antenna. It is sensitive to small variations in depth or permittivity contrast but, because of the
phase periodicity, absolute depths are undetermined. On a processed RASCAN plan-view image, objects can often be identified directly by their
shape and texture. This is a great simplification compared with the B-scan compilation and migration analysis needed for impulse radar.
The inspiration for this work is humanitarian demining and, in particular, the problem of distinguishing mines from 'clutter',
or harmless battlefield rubbish. Records (for example from Cambodia(1)) show that over 99% of a deminer's time may be spent removing
clutter or harmless items. The traditional metal detector and probing sapper spike are slow and dangerous, especially with modern plastic mines,
with one deminer casualty per 1000 mines recovered(2). Impulse radar with a high centre frequency (1 - 2 GHz) has long been used for
mine detection and some specialised systems are now in routine use(3,4). However, they remain relatively expensive and suffer from soil-antenna
reverberations, requiring filtering to avoid a dead zone at very shallow (up to 50 mm) depths(5,6). The advantages of impulse radar are
high axial resolution and good penetration in soil due to the high peak power and time-varying gain amplification of the later (deeper)
reflections. These advantages have stimulated the development of dual-sensor systems combining impulse radar with a metal detector.
Daniels(7) reviews this technology for landmine detection and defines the key features for successful field systems. It is likely that
different environments will require different approaches, and the approach reported here will not be universally applicable.
This study considers an alternative radar technology: holographic radar with high-frequency (4 GHz) continuous wave signals and baseband
demodulation circuitry. The system is designed to operate in the near field with an antenna footprint of about half of the signal wavelength.
This implies a spatial resolution of about 10 mm at 4 GHz in dry soil. The utility of holographic radar has been demonstrated for
different targets at different depths(8,9) to establish the penetration depth and resolution metrics. The RASCAN system has two
receivers with parallel and cross polarisation to ensure the detection of arbitrarily oriented elongated objects. The 4
GHz RASCAN-4/4000 is capable of recording phase variations due to dielectric contrasts for targets buried up to one wavelength in
soil (~75 mm for a dry soil with phase velocity 1 x 10⁸ m/s). Deeper objects can be detected, at the expense of a decreasing plan-view
resolution, by decreasing the operating frequency to 2 GHz, as demonstrated in the RASCAN-4/2000 version.
Research on the RASCAN system for demining has been conducted for several years(10,11,12). Of course, as stated by
MacDonald et al(1) and known as a practical matter by deminers themselves, 'no single mine detection technology can operate effectively
against all mine types in all settings', and the principal limitation of radar is its limited effective penetration in damp soils
(due to attenuation) or inhomogeneous soils (due to scattering). Soil characterisation for conventional radar has been extensively
investigated(13). However, holographic radar presents slightly different problems, which have not been so well investigated.
In particular, soil surface unevenness and exposed stones can give strong signals. This is an area of active research. Work to be
reported at the 2012 Ground Penetrating Radar Conference in Shanghai shows that undulations and projections in the sand surface of
around 15 mm spread gave interference signals that were strong enough to disguise the signal from a buried stimulant mine. However,
placing a smoothed layer of suitable sand over the uneven surface mitigated the problem and revealed the mine. In this case, the amount
of new sand corresponded to an average depth of about 6 mm, or 6 litres per square metre of area. This amount is small enough to help
in exceptional cases, although it would not be practical for all situations. The holographic radar signals from an uneven surface
could be corrected by, for example, an ultrasonic range finder scanned along with the radar sensor. Quadrature receivers may allow
focusing of buried objects (14). The problems have yet to be solved but progress is being made. However, in dry
homogeneous soils, the present study suggests that holographic radar works well enough that it could provide a possible
contribution to the clutter problem after further development. A sophisticated approach to detection and classification
using principal component analysis is described in Daniels' Ground Penetrating Radar (15) and in Miao et al(16).
Other approaches based on neural networks have been applied to impulse radar images using pre-processing and feature extraction
to reduce the dimensionality of the training data(17,18,19,20).
Figure 1. The five objects buried in the sand for this experiment.
At the bottom-left is a plastic sweet container filled with sugar representing a simulated mine.
At the top-right is an unexploded shell representing an example of unexploded ordnance.
At the top-left is a squashed aluminium can and at the bottom-right is a small length of barbed wire.
In the centre is a large stone. The ruler is 300 mm long and is shown for scale only.
This photo corresponds to the neural network validation Run 140. 2. The holographic radar experiment
For these experiments the following objects were buried:
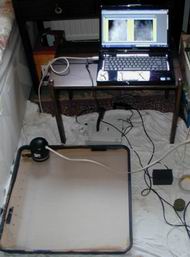
Figure 2. The set-up for the laboratory experiments at East Hagbourne.
On the bottom left is the sandbox. The black cylindrical object at the upper end of the sand pit is the
4GHz Rascan head. It rests on a thin Perspex sheet. The white box on the floor just above the sand pit
is the Rascan control box. This connects to a 12 V power supply (not in the photo) and the laptop which
shows the image raster-by-raster in real time. The RASCAN system(22) has five distinct frequencies from 3.6 to 4.0 GHz, with both parallel and perpendicular
polarisations so that the raw data appear in 10 images. The scans were made by hand using the set-up in Figure 2.
The sandpit was a square plastic garden tray, with dimensions of 570 x 570 x 75 mm deep, filled to the brim with sand.
On the surface of the sand was a thin (~1 mm) plastic sheet on which parallel lines were ruled at 10 mm intervals.
A line at right angles determined the starting point of each raster scan line. Each complete scan took about
4 min to perform manually. The scanning method and time are not limitations since the antenna can be mounted
on a mechanical scanner for field deployment.
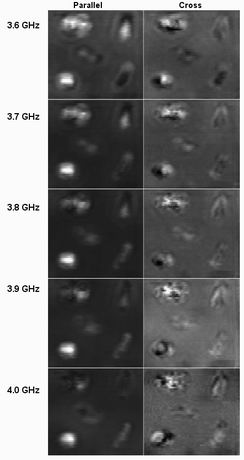
Figure 3. The raw data collected for Run 140, whose objects before they were buried
were shown in Figure 1. The two columns represent the parallel and cross polarizations, and the phase of the product
of the reflected and incident signals on an arbitrary scale with light the positive phase and dark the negative phase.
Images are 400 mm x 480 mm with pixel size 10 mm. Figure 3 shows the raw RASCAN images for the object layout in Figure 1. The background phase varies slightly
with the frequency and polarisation and the object images differ slightly. For example, the simulated mine at the
bottom left shows as a white circle in most of the parallel images, but as a complex striped image in the cross
polarisation. The human eye finds these 10 distinct images confusing as there is no single image that can be
associated with our five objects. Automated image processing has a similar difficulty, since there is
no 'template' that can be matched to unknown objects in test images.
3. The 'summed modulus' display
The images in Figure 3 contain useful information, but are not conducive to automated interpretation.
To facilitate automated image analysis, the 10 images of Figure 3 have been combined into a single image
using the 'summed modulus' described by Windsor et al. (23). In this procedure, the absolute
values of the phase signal amplitude are summed less the average background phase over the whole image.
In mathematical terms the composite signal S(x,y) at positions x and y in the image is
S(x,y) = S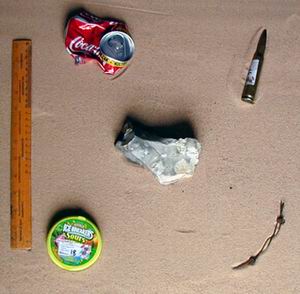
1. A simulated plastic mine consisting of a cylindrical plastic sweet container, with 80 mm diameter and 20 mm height,
filled with granulated sugar (relative dielectric of 3.0) to simulate the properties of the plastic explosive filling
of an actual mine (relative dielectric of 2.9(21)). This produced no signal at all on a metal detector.
2. A piece of unexploded ordnance (UXO) consisting of an inert brass shell and steel projectile with a length of 130 mm
and a diameter of 21 mm. It weighed 100 g and gave a strong metal detector signal.
3. A bit of metal trash. This was a 'Coca-Cola' can that was crushed into an irregular shape about 100 mm by 80 mm.
Its weight was 15 g and it also gave a strong metal detector signal.
4. A piece of rusty barbed wire about 130 mm long and bent into a slight curve. It weighed 10 g and gave a weak metal detector signal.
5. An irregular stone of about 120 x 75 x 40 mm and weighing 500 g. It gave no metal detector signal.
For each of 12 similar scans, the objects were buried with different positions, orientations and depths. Figure 1
shows the five objects lying above the sand in one randomised configuration. Objects were spaced so their reflected
waves did not interfere at depths of up to about 75 mm, mimicking the small depth typical of many buried landmines.
where Ai,j(x,y) is the signal amplitude at position (x,y) at frequency i
and polarization j and Bi,j is the background amplitude of each image averaged
over all pixels. The summation runs over the five frequencies and the two polarizations.
The resulting image is shown in Figure 4, and the 'background' appears generally dark with significant
deviations of either phase showing as light. The raw images of figure 3 remain difficult to classify
either by eye or computer. The parallel mine simulant images may be circular but the cross images at
3.6 an 3.7 GHz appear as light and dark ellipsoids, while those at higher frequencies have an irregular
'texture' of indeterminate shape. Both eye and computer have difficulty assimilating the ten distinct
images presented to them. In the single image of figure 4 the complications are averaged out and the
circular mine simulant appears as a light circular image on a dark background on all the measured scans.
Both eye and computer now have an image for each type of object which, although slightly more blurred
than the original raw images, can be uniquely associated with that object. Classification becomes practicable.
Figure 4. The summed modulus of the signal amplitudes at each pixel
less the average background level for the data from Run 140 shown in Figure 3 and corresponding to the
objects photographed in Figure 1. The pixel size is 10 mm in both directions and the image size is 400 mm
across and 480 mm high. The objects in the order (left to right and top to bottom) are (3, 2, 5, 1, 4)
for the numbered objects defined in section 2. 4. Object location with a receptive field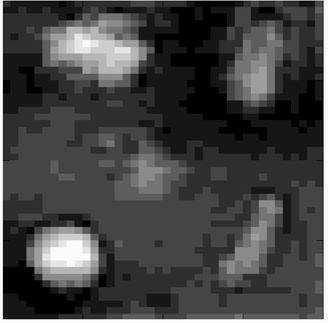
Figure 5. Runs 139, 138 and 137 (left to right) similar to Figure 4 but
with the positions, orientations and depths of the five buried objects randomly changed.
With Figures 1 and 4 as a training guide, the reader is invited to locate the simulated mine in each scan.
The objects have the order in the notation of Figure 4: (2,5,1,4,3), (1,4,3,5,2) and (4, 1 5, 3, 2).
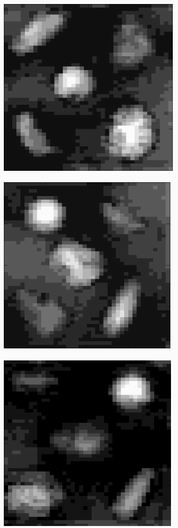 In the summed modulus image (Figure 4), the simulated mine and the four clutter objects appear as distinct
shapes and textures that the human eye or computer can learn to locate and classify. The simulated mine has
a high amplitude and round shape. The squashed can has a texture different from the mine and an outline that
mimics the shape of the can. The unexploded shell maintains its elongated shape. The arc of the barbed wire
has lost the stripes seen in Figure 4. The stone is low amplitude and irregular in shape. These images can
easily be interpreted by eye. Figure 5 shows the summed modulus images from runs 139, 138 and 137 and the
reader is invited to identify the mine.
The method for automatically locating objects within the images
employs a scanned 'receptive field' followed by a neural network(24),
as used previously by the authors to locate defects in steel welds. An illustrative diagram of the method
is shown in Figure 6.
Figure 6. An illustrative diagram of the methods used by our eyes and in this paper.
The eye sweeps over the image using its central region, the macula, to search for areas of interest.
Our visual cortex then analyses the image. In our method a receptive field (illustrated here with 3x3 pixels
sweeps over the image in a raster scan. Local 3x3 pixel areas of interest are presented to a neural network
trained to recognize particular features such as circles and lines in this example. 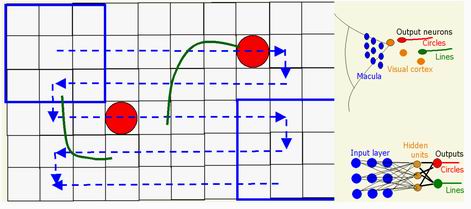
A small area (for example 11 x 11 pixels) is swept across the image searching for a high signal amplitude.
The best location for object centres was achieved by sweeping a pyramidal amplitude profile over the image.
The receptive field position with the highest summed weighted amplitude within the image was extracted and
saved for further analysis and the amplitude within the receptive field area replaced by the average amplitude
over the image. The position with the next highest weighted amplitude is then found and so on until all
positions with weighted amplitudes above some specified minimum amplitude have been found. An example of
this is given in Figure 7 for run 139 (shown on the left in Figure 5).
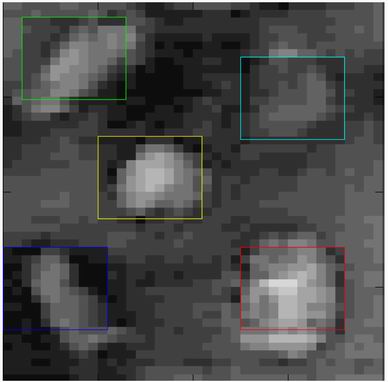
Figure 7.The positions in the image of Run 139 where an 11x11 pixel receptive
field with a pyramidal amplitude profile has given the largest weighted summed amplitudes.
The weighted signals are presented in the order of decreasing amplitude: red (bottom right: can),
yellow (center: mine), green (top left: shell), blue (bottom left: wire) and magenta (top right: stone)
If the receptive field is made too small (for example 9 x 9 pixels), then the larger objects, such as
the squashed can at the bottom right, are not completely removed by replacement with the average amplitude
in the receptive field area. On the other hand, if it is too large, then a central region containing the
object is surrounded by background and the network complexity is wasted.
5. Object classification using a neural network
The next step was to collect a series of receptive field images for use in training and optimising a neural network. Before each scan, the five objects; mine, shell, can, wire and stone were placed in the sand at random positions, orientations, and depths with the actual positions noted. For each run, all of the 11x11 receptive fields containing known objects were saved to form the training, testing, and validation images for the neural net. For six runs, not all the objects were located by the receptive field, leaving 54 receptive field images from known object types to be used in the analysis.
Neural networks have been described by Bishop (25). In this case, they provide a non-linear
mapping between the 121 pixels of an object image, and a series of outputs, which represent each of
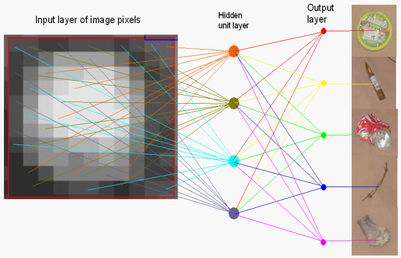
the target types to be classified. An example of a classic Rumelhart network (26) is shown in Figure 8.
The network has three layers, an input layer, which carries the pixel amplitudes of the receptive field images,
a hidden layer, and an output layer representing the objects to be classified.
Figure 8. The form of the Rumelhart network used in this study.
The pixel amplitudes found by the scanned receptive field form the input layer to a 3-layer network.
The middle hidden unit layer has full connectivity with both the input and output layers.
To determine the optimal neural network, the available data were divided into training, testing,
and validation fractions. The training data were used to find the network best predicting the output
target values from given inputs. The test data were used to optimize the complexity of the neural
network to minimize a performance metric. The validation data, being previously unseen by the
optimization process, were used as a blind test of the network. In this study, just the 5 images
from Run 140 are used as validation data.
Figure 9. The 49 training and testing images used in this study.
(The five validation images are missing from this figure). Going left to right and top to bottom,
the first 12 images are from simulated mines (red): the next 11 images are from the unexploded shell
(yellow) and the next 11 images are from the can (green). The next 7 images are from the wire (blue)
and the last six images are from the stone (violet). These images are randomized in order
when training and testing.
6. Results of the classification of buried test objects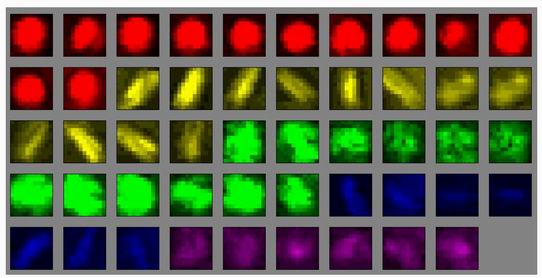
The 49 training and testing images are shown in Figure 9. Note that the simulated mines consistently display round shape and high contrast. The shell and wire have distinct elongate shape, with the wire being weaker and curved. The can has a speckled texture, due to its crumpled surface. This set of 49 images was randomly divided into 70% training (37 images) and 30% testing data (19 images). The targets for the five outputs were defined as (1 0 0 0 0), (0 1 0 0 0), (0 0 1 0 0), (0 0 0 1 0) and (0 0 0 0 1) for the mine, shell, can, wire and stone respectively. During training, the network weights are adjusted to reduce the residual given by the sum of the squared differences between the current network output values and the known targets, summed over all classes. Generally, the greater the number of hidden units, the greater number of adjustable weights, the better the fit of the outputs to their targets, and the lower the training residual. This may not be true for the test residual if there is over-parameterization or 'over-fitting'. As with least squares fitting in two dimensions, a high number of parameters may fit the training data well, but the test data poorly. Closely fit training data may suggest a spurious precision.
After training, the test data were presented to the network and the performance defined by the
percentage of correct identifications and the percentage of false alarms. The network was
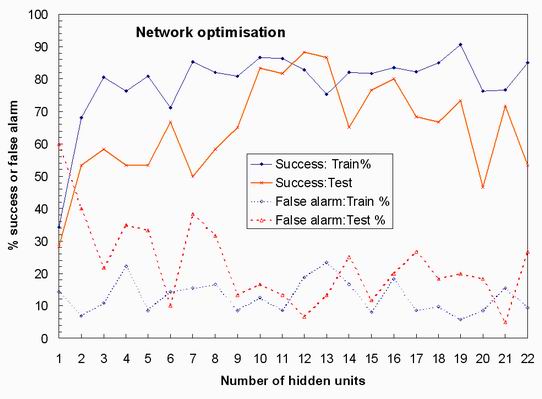
optimized by varying the number of hidden nodes as illustrated in Figure 10. An optimal
performance (maximum detection and minimum false alarms) was obtained for ~12 hidden units.
Figure 10. The training and test performance of the network as a
function of hidden unit number. Full lines are training (blue) and testing (red) success rates
which should have a high value. False alarm rates are dashed and should have a low value.
While the training performance reaches a plateau, the test performance has a maximum value at
about 12 hidden units. Although there is much scatter, the false alarm rate also shows evidence
of a minimum at about this point.
The performance statistics for the optimal 12 hidden node network are shown in Table 1.
The simulated mine gave 100 % identification and zero false alarms for both training and testing.
The clutter objects gave less than perfect identification and non-zero false alarms for both
training and testing.
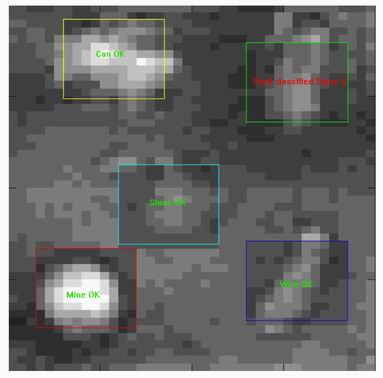
Table I. Identification and false alarm rates for training and testing and for each object type
| - | - | Success | % | False alarm | % |
| - | - | Train | Test | Train | Test |
| 1 | Mine | 100.0 | 100.0 | 0.0 | 0.0 |
| 2 | Shell | 87.5.0 | 66.7 | 0.0 | 0.0 |
| 3 | Can | 100.0 | 75.0 | 0.0 | 25.0 |
| 4 | Wire | 100.0 | 50.0 | 60.0 | 50.0 |
| 5 | Stone | 75.0 | 75.0 | 0.0 | 0.0 |
| - | Overall: | 92.5 | 73.3 | 12.0 | 15.0 |
Figure 11. The validation Run 140, unseen in the training and testing process, classified by the trained neural network. The Mine, Can, Wire and Stone were correctly classified but the shell was miss-classified as a Stone.
7. Validation with an inert PPM-2 mine
For the validation scan (Run 140) the receptive field positions and trained neural net results
are shown in Figure 11. The mine and the can are correctly identified, as are the wire and stone,
but the shell is misidentified as a stone. In more critical situations, the well-known classic
Rumulhart back propagation network(26) used here could be replaced by more sophisticated
Bayesian codes(25) that are able to estimate the reliability of the prediction as well
as its value. However with either code, accuracy is largely determined by the amount and quality
of the training data. In the field this training data could be continuously updated to correspond
ever more closely with the particular mine simulants and clutter objects being found in that
particular area. (27,28)
Figure 12. The inert PPM-2 anti-personnel mine. At the top left is
a photo of the mine. Its diameter is close to 120 mm. On the right are the 10 images taken by the
Rascan system. The polarizations and frequencies are as in Figure 4. At the bottom left is the
single summed modulus image produced as described in section 3. The 10 mm pixels are clearly seen.
6. Validation with an inert PPM-2 mine Figure 13. On the left is the chosen receptive field area for the
simulant mine in Run 140 at a scale of 10 mm per pixel. On the right is the simulant area chosen
receptive field area for the scaled image of the inert PPM-2 mine with an original pixel size of
15 mm, now scaled to 10 mm.
7. Conclusions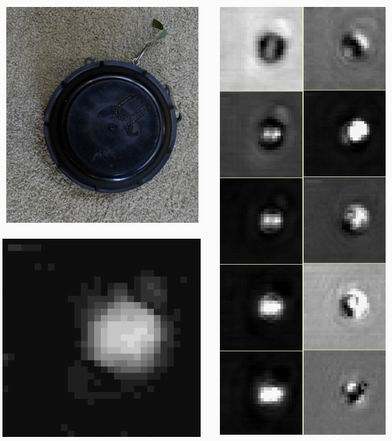
In the dry sand used in this study, 4 GHz holographic radar provides clear subsurface imaging
with a resolution of about a centimetre; sufficient to distinguish object shape by eye or by
machine image analysis. The neural network approach for the simulated gave 100% identification
with no false alarms, while the clutter object tests yielded on average 82% identification and
16% false alarms. Successful validations were achieved with a mine simulant and clutter scan and
with a scaled scan of an inert PPM-2. Further tests are planned with less favourable soils and
other clutter and minimum-metal mines.
Acknowledgments References
1. J MacDonald, JR Lockwood, J McFee, T Altshuler, T Broach, L Carin, R Harmon, C Rappaport, W Scott and R Weaver, Alternatives for Landmine Detection, 2003, Rand Science and Technology Policy Institute, http://www.rand.org/pubs/monograph_reports/MR1608.html#toc
2. H Hasan, Prohibition of the Use, Stockpiling, Production and Transfer of Anti-personnel Mines and on their destruction, 1950, www.munfw.org/archive/50th/4th2.htm, : Minetect: www.cobham.com/about-cobham/avionics-and-surveillance/about-us/technical-services/leatherhead/services/antenna-and-electronic-systems/case-studies/minehound-vmr2.aspx www.era.co.uk/Docs/Electronics/Minetect.pdf
4. HSTAMIDS USA portable mine detection system http://maic.jmu.edu/journal/12.1/rd/cresci/cresci.htm
5. A van der Merwe and I J Gupta A Novel Signal Processing Technique for Clutter Reduction in GPR Measurements of Small, Shallow Land Mines IEEE TRANSACTIONS ON GEOSCIENCE AND REMOTE SENSING, VOL. 38, NO. 6, NOVEMBER 2000 pp 2627-2637
6. O Lopera, E C Slob, N Milisavljevic, and S Lambot Filtering Soil Surface and Antenna Effects from GPR Data to Enhance Landmine Detection IEEE TRANSACTIONS ON GEOSCIENCE AND REMOTE SENSING, VOL. 45, NO. 3, MARCH 2007 pp 707-717
7. D J Daniels, A review of GPR for landmine detection, Sensing and Imaging: An International Journal, Vol. 7, No. 3, September 2006, pp 90-123
8. L Capineri, S Ivashov, T Bechtel, A Zhuravlev, P Falorni, C Windsor, G Borgioli, I Vasiliev, and A Sheyko Comparison of GPR Sensor Types for Landmine Detection and Discrimination, 12th International Conference on Ground Penetrating Radar, June 16-19, 2008, Birmingham, UK, www.rslab.ru/downloads/capineri_et_al.pdf
9. E Bechtel, S Ivashov, T Bechtel, E Arsenyeva, A Zhuravlev, I Vasiliev, V Razevig, and A Sheyko, Experimental Determination of the Resolution of the RASCAN-4/4000 Holographic Radar System, 12th International Conference on Ground Penetrating Radar, June 16-19, 2008, Birmingham, UK. www.rslab.ru/downloads/bechtel_et_al.pdf
10. S I Ivashov, V N Sablin, I A Vasilyev, Wide-Span Systems of Mine Detection IEEE Aerospace & Electronic Systems Magazine. May 1999, Vol. 14, No. 5, pp. 6-8. www.rslab.ru/downloads/00765772.pdf
11. S I Ivashov, V I Makarenkov, V V Razevig, V N Sablin, A P Sheyko, I A Vasiliev, Remote Control Mine Detection System with GPR and Metal Detector, Eighth International Conference on Ground-Penetrating Radar, GPR'2000, May 23-26, (2000), University of Queensland, Gold Coast, Queensland, Australia, pp. 36-39. www.rslab.ru/downloads/mines_gpr_2000.pdf
12. S I Ivashov, V V Razevig, AP Sheyko, I A Vasilyev, A Review of the Remote Sensing Laboratory's Techniques for Humanitarian Demining, Proceedings of International Conference on Requirements and Technologies for the Detection, Removal and Neutralization of Landmines and UXO, EUDEM2-SCOT-2003, 15-18 September 2003, Vrije Universiteit Brussel, Brussels, Belgium, 2003, Vol. 1, pp 3-8. www.rslab.ru/downloads/paper_id106.pdf
13. CEN Workshop Agreement CWA 14747-2-2008. Humanitarian mine action - Test and evaluation - Part 2: Soil characterization for metal detector and ground penetrating radar performance. http://www.evs.ee/preview/cwa-14747-2-2008-en.pdf">www.evs.ee/preview/cwa-14747-2-2008-en.pdf
14. A Zhuravlev, A Bugaev, S Ivashov, V Razevig, and I Vasiliev. Microwave holography in detection of hidden objects under the surface and beneath clothes. XXX International Union of Radio Science (URSI) General Assembly. Istanbul, Turkey, August 13-20, 2011. www.ursi.org/proceedings/procGA11/ursi/BP1-30.pdf
15. D Daniels, Ground Penetrating Radar, Institution of Engineering and Technology, London, UK, Second Edition, 2007.
16. Xi Miao, Mahmood R Azimi-Sadjadi, Bin Tian, Abinash C Dubey, and Ned H Witherspoon Detection of Mines and Minelike Targets Using Principal Component and Neural-Network Methods, IEEE TRANSACTIONS ON NEURAL NETWORKS, VOL. 9, NO. 3, MAY 1998, pp 454-463
17. Chih-Chung Yang and N K Bose, Landmine Detection and Classification With Complex-Valued Hybrid Neural Network Using Scattering Parameters Dataset IEEE TRANSACTIONS ON NEURAL NETWORKS, VOL. 16, NO. 3, MAY 2005 pp 743-753
18. M R Azimi-Sadjadi and S A Stricker, Detection and classification of buried dielectric anomalies using neural networks-further results, IEEE Trans. Instrum. Meas., vol. 43, no. 1, pp. 34-39, Feb. 1994.
19. P D Gader, M Mystkowski, and Y Zhao, Landmine detection with ground penetrating radar using hidden Markov models, IEEE Trans. Geosci. Remote Sens., vol. 39, no. 6, pp. 1231-1243, Nov. 2001.
20. L Capineri, P Falorni and C Windsor, Buried Mine Classification from three-dimensional RADAR data, INSIGHT 35, 15-22, 1993, freespace.virgin.net/colin.windsor/3dmines/3dmines.htm
21. B. Sai, I Morrow, and P van Genderen Limits of Detection of Buried Landmines Based on Local Echo Contrasts European Microwave Conference, Amsterdam, 1998, home.tudelft.nl/fileadmin/UD/MenC/Support/Internet/TU_Website/TU_Delft_portal/Onderzoek/Kenniscentra/Kenniscentra/IRCTR/Research/GPR/Publications/Systems/doc/landmine.PDF
22. S Ivashov et al., The Holographic Principle in Subsurface Radar Technology, International Symposium to Commemorate the 60th Anniversary of the Invention of Holography, Springfield, Massachusetts USA, October 27-29, 2008, pp. 183-197. www.rslab.ru/downloads/ivashov_sem_2008.pdf
23. C G Windsor et al., A Single Display for RASCAN 5-frequency 2-polarisation Holographic Radar Scans, PIERS ONLINE, vol. 5, no. 5, pp. 496-500, 2009 www.piers.org/piersonline/piers.php?volume=5&number=5&page=496
24. C G Windsor et al., The Classification of Weld defects from ultrasonic images: a neural network approach, INSIGHT, vol. 35, pp. 15-21,1993, Presented at the 31st Annual British Conference on NDT, September 1992.
25. C M Bishop, Neural networks for pattern recognition, 1996, Clarendon Press, Oxford.
26. D E Rumelhart and J L McClelland (Eds) Parallel Distributed Processing, Cambridge: MIT Press, 1986.
27. Jane's Military Vehicles and Logistics, 1995, Bracknell, RG12 8FB, UK, www.janes.com/articles/Janes-Military-Vehicles-and-Logistics/PPM-2-Anti-personnel-Mine-Germany.html
28. C Stergiou and D Siganos, Neural Networks, For example sections 5 and 6.3.1
29. T Houlahan, Mine Field Breaching in Desert Storm Journal of Mine Action, vol. 5.3, December, 2001, http://maic.jmu.edu/journal/5.3/focus/thomas_houlihan/thomas_houlihan.htm
30. The Rascan website: www.rascan.org