
Progress In Electromagnetics Research Symposium Proceedings,
Moscow, Russia, 757-762, 2009:
A single display for RASCAN 5-frequency 2-polarisation holographic radar scans Colin Windsor(1), A. Bulletti(2) , L. Capineri(2), P. Falorni(2),
S. Valentini(2), G. Borgioli(2), M. Inagaki(3), T. Bechtel(4), F. Bechtel(4), E. Bechtel(4) , A. Zhuravlev(5), S. Ivashov(5)
(2)Department of Electronic Engineering, University of Florence, Via S. Marta 3, 50139
Florence, Italy
(3) Walnut Ltd, 4-2-54 Sakaecho Tachikawa 190, Japan
(4) Enviroscan Inc, 1051 Columbia Avenue, Lancaster,PA 17603, USA
(5) Remote Sensing Laboratory, Bauman Moscow State Technical University, Russia
Abstract- The RASCAN holographic radar system has been developed by the Remote Sensing Laboratory of Bauman Moscow Technical University. The present design uses five frequencies and two polarisations to give 10 distinct images of scan from buried objects. Because of the sinusoidal phase variation of the interference signals, all displays show a complex picture of dark and light phases which vary in a complicated way between different frequencies and polarizations. This is a preliminary investigation into the optimal presentation of the 10 images as a single composite image. The objective is to display as much as possible of the information present in the original image. The solution presented here is to sum the absolute values of the background-corrected amplitude over both the five frequencies and the two polarizations. The method is justified using an experiment in which nine US pennies, and 9 metal washers, were buried in sand at increasing depths in the range 0 to 56 mm. The method is illustrated by example images from the fields of civil engineering and mine detection.
1. Introduction
Conventional Ground Penetrating Radar uses echo sounding from a pulsed source
to determine the range of buried objects [1]. A quite different radar system was developed
by the Remote Sensing Laboratory of Bauman Moscow Technical University [2]. Their RASCAN
system uses continuous wave unmodulated signals at several different frequencies.
The signal reflected from the subsurface structure is multiplied by the original signal
from the antenna to form a hologram. The amplitude and phase of the hologram is sensitive
to the depth of any buried object, to its reflectivity and to the properties of the medium.
The indication of depth is indicated by the phase change of the radar wave in passing
through the material to the buried object. The indication of reflectivity is given by the
amplitude of the reflected signal. Generally the antenna and receiver are the same, and
placed close to the ground surface. The holographic amplitude and phase may be presented
as a function of position (x, y) across the ground surface and scanned manually or
automatically to give a holographic image H(x,y) whose amplitude may be plotted as a
grey scale image. In the RASCAN system five frequencies are operated simultaneously to give
five different holographic images whose amplitude and phase response differs as the phase
change caused by the phase difference along the path length alters. The RASCAN system also
has two perpendicular polarizations so that the response may be measured both along and
perpendicular to the scanning direction.
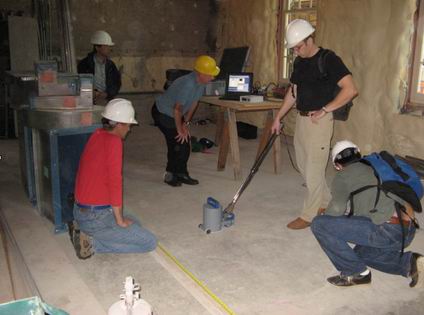
Fig. 1. The floor scan at the Fackenthal Hall in progress. The RASCAN head is being swept along the scan direction. The progress of the scan could be watched on the monitor behind.
The RASCAN system thus results in 10 different holographic response images. The RASCAN display software allows all 10 images to be displayed either simultaneously, or as a time-sequence set of images. Neither is completely satisfactory for use by unskilled operators and the present paper considers ways in which the 10 individual holograms may be combined into a single composite image.2. The conventional display from a typical RASCAN image
As an example image, a floor scan of a concrete floor containing conduits, metal
meshes and metal pan decking has been chosen. The scan was made at the Fackenthal Hall at
Franklin and Marshall College, Lancaster, USA. Figure 1 shows the floor in question, with
the RASCAN being manually pushed along the scan direction (x). The scan length was 500 mm
with measurements every 5 mm. The scans were repeated at 20 mm intervals along the direction
perpendicular to the scan (y), over 2m. This gave 100x100 points in total although the images
displayed here will only extend over only 60x60 points as much of the scan is a repetitive
background. Figure 2 shows the display given by the RASCAN software.
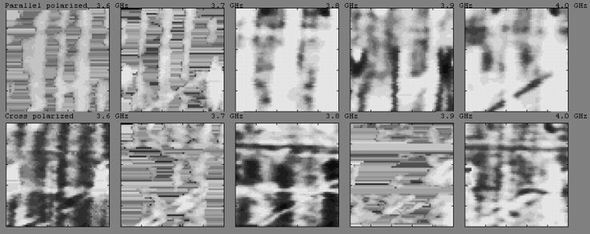
Figure 2. The display from the RASCAN software. The five frequencies from 3.6 to 4.0 Ghz are displayed from left to right and the two polarisations are parallel above and cross polarised below.
Several sets of features are visible in these images. The thin vertical bands sometimes light,
sometimes dark, are likely to be the vertical rebars. The broader bands seen at other frequencies
are likely to be the corrugations of the pan decking. The thin horizontal bands, more clearly
seen on the cross polarization are likely to be the horizontal rebars. At the lower right is
clearly seen a diagonal electrical conduit that appears either light or dark in many of the
images. This series of images is clearly not straightforward to understand without careful
study of all the images. Can this process be simplified without loss of detail?
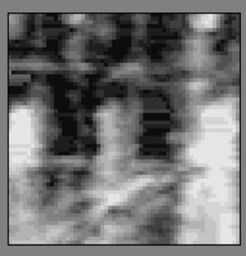
Figure 3. A single image display generated from the RASCAN scan above. The image is sum of the differences from the background level summed over all the ten images shown above. All the featues mentioned above may be seen.
The RASCAN software package has one such process. An option is to display the images within each polarisation direction in sequence. It helps greatly in the process of assimilating the data together.
An example of our approach is shown in figure 3. The method has many options and this is
just one result. The method will be explored in more detail using images from a much simpler
example: a series of buried pennies of different depths.
3.The method explored for a simple RASCAN image
Figure 4 above, shows raw RASCAN data from a scan over 9 US pennies buried in sand at
increasing depths from about zero on the left to about 65 mm on the right. Only the
parallel polarisation is shown. The scan length and separation were both 1 cm. These
experiments are presented in more detail in reference [4] from this meeting. The lower
set of circles were some other foreign coins, and are not analysed here.
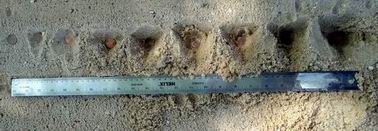
Figure 4. A set of nine US pennies buried in sand at different depths and is set of RASCAN images in the parallel polarisation.

The scans were
made along the direction of increasing depth by manually moving the RASCAN head on a glass
plate over the sand surface.
An interesting feature is that the background level at each frequency is quite different.
In holographic radar there is no specific "main bang" ground reflection from the surface.
In this case it is an air-sand interface covered by a thin plastic sheet. Rather the amplitude
and phase of the reflected wave from the surface interferes with the incident wave to give
a characteristic background signal level. In this example, there was a wide region of sand
without pennies that could be analysed to give the background level.
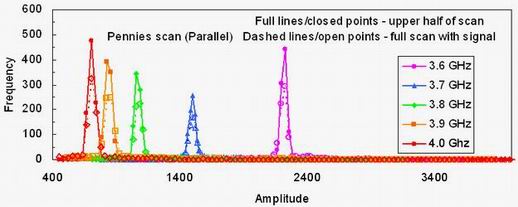
Figure 5. The histogram of signal amplitudes over the raw data from a scan over 9 US pennies buried in sand. The scan showed a larger region of background than is shown in figure 3. Note the change in amplitude with frequency.
Figure 5 shows the
histogram of the amplitudes for each of the frequencies. There is width to the peak in
amplitude at each frequency and a small almost invisible "tail" to the distribution from
the much larger amplitude variations present in the portion of the scan representing the
pennies. This background level is important in since it enables "contrast", or deviation
from background, to be identified. Positive and negative phases have at last a clear meaning.
In the pennies scan that particular scan giving the largest amplitude across each penny
was identified, (almost always one particular scan) and the coloured lines in figure 6
shows this scan for each of the five frequencies. It is seen that for penny 1 all the
frequencies show a positive peak. For penny 2 the 3.7 GHz peak has the largest positive
amplitude and the 3.9 GHz the largest negative peak. For penny 4 the 4.0 GHz peak has the
largest positive amplitude and the 3.6 GHz the largest negative amplitude.
By penny 6 this situation is almost reversed.
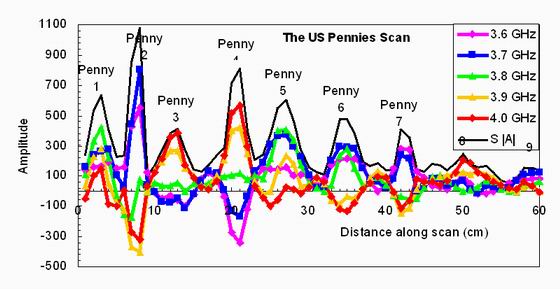
Figure 6. The amplitude along the scan of pennies for the five frequencies (coloured) and for the summed absolute amplitude (black).
The full line in figure 6 shows the sum of the five frequencies of the modulus of the amplitude
F=Sf /Af(x) - Bf /
where the summation is over frequencies f, Af(x) is a the
amplitude at frequency f and position x, and Bf is the background.
Figure 7 shows this representation for the pennies scan. The first seven pennies are
clearly delineated with positive signals and there are suggestions of the remaining two deeper pennies.
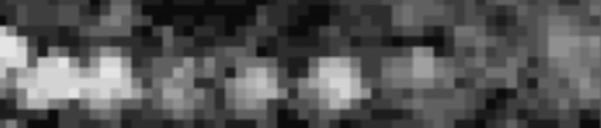
Figure 7. The mean modulus of the amplitude for the pennies scan.
4.Some examples of the combined image for other RASCAN images
Returning to the Fackenthal Hall location a second image was taken of an interesting location
which showed two holes 16 cm diameter separated by 36 cm. The scans are again parallel to the
corrugations. A portion of the RASCAN data collected are shown in figure 8 with the same
presentation as with the scan of figure 2. Much is seen in this image: in particular the
two holes appear with varying phases. Some scans show clear vertical lines which are
probably from electrical conduit which approach the holes in both directions.
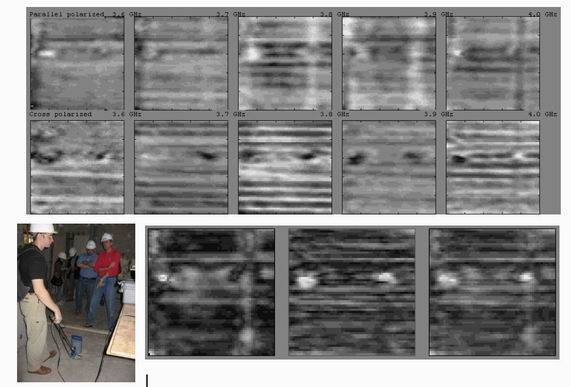
Figure 8. Above, a second RASCAN at the Fackenthal Hall over an area containing two holes and several unknown signals. On the left is shown the scene and below is shown the composite image from parallel perpendicular and combined polarisations.
In the lower part of figure 8 the two polarisations, parallel and perpendicular to the scan direction (left to right) are shown separately. In this case they are appreciably different with the corrugations being much clearer in the parallel direction.
A third example is RASCAN image of simulated mines and is from the published literature [3].
In figure 9 above is shown on the left the four simulated mines. Two of the simulants were
made of metal and they are easily picked up by the metal detector scan shown in the centre
of the figure. On the right is shown the amplitude composite image. This is presented on a
logarithmic scale and shows some noise background. However the two metal mines are also
seen very clearly, as is a length of metal wire which was placed beneath the sand surface.
The two plastic simulants are seen on the lower left and right. The rather conspicuous
object in the lower centre of the figure is a "knee print" from one of the operators.
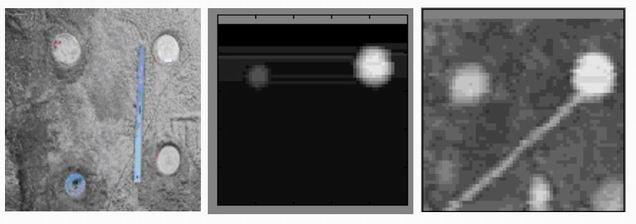
Figure 9. A scan from the garden in the University of Florence previously reported [1]. The mine simulant objects are shown on the left, the metal detector image in the centre and the composity single image on the right.
5. Conclusions
A method for combining the ten images given by the RASCAN system is proposed based on a sum of the modulus of the background-corrected amplitudes, without affecting the spatial resolution.
In the pennies experiment the summed images showed all pennies distinctly. In the Fackenthal Hall experiment the summed images showed all the expected features, including the conduit, the metal mesh and the deeper metal pan decking.
In the test bed of the University of Florence experiment with simulated mines, all four mines, two metal and two plastic were all seen satisfactorily.
The precise form of the average over background corrected amplitudes does not seem critical.
6. References
1. Daniels D J, Surface penetrating radar for industrial and security applications, Microwave Journal,
December 1994, pp 68-82.
2. L Capineri, S Ivashov, T Bechtel, A Zhuravlev, P Falorni, C Windsor, G Borgioli, I Vasiliev and A Sheyko,
Comparison of GPR Sensor Types for Landmine Detection and Discrimination
12th International Conference on Ground Penetrating Radar, GPR 2008, Birmingham, UK
3. S I Ivashov et al, Holographic subsurface radar Technique and it applications,
12th International Conference on Ground Penetrating Radar, GPR 2008, Birmingham, UK
4. C Windsor, A Bulletti, L Capineri, P Falorni, S Valentini, M Inagaki, T Bechtel,
E Bechtel, A Zhuravlev, S Ivashov, Depth information from holographic radar scans,
PIERS 2009, Moscow (This conference)